
Compare Marble City with Similar Stocks
Dashboard
Low ability to service debt as the company has a high Debt to EBITDA ratio of 4.77 times
- Low ability to service debt as the company has a high Debt to EBITDA ratio of 4.77 times
- The company has been able to generate a Return on Equity (avg) of 6.35% signifying low profitability per unit of shareholders funds
Flat results in Mar 26
With ROCE of 11.6, it has a Expensive valuation with a 2.3 Enterprise value to Capital Employed
Underperformed the market in the last 1 year
Total Returns (Price + Dividend) 
Marble City for the last several years.
Risk Adjusted Returns v/s
Returns Beta

News

Marble City India Ltd is Rated Sell
Marble City India Ltd is rated 'Sell' by MarketsMOJO, with this rating last updated on 27 May 2026. However, the analysis and financial metrics discussed here reflect the stock's current position as of 05 July 2026, providing investors with the latest insights into its performance and outlook.
Read full news article
Marble City India Ltd is Rated Sell
Marble City India Ltd is rated 'Sell' by MarketsMOJO, with this rating last updated on 27 May 2026. However, the analysis and financial metrics discussed here reflect the stock's current position as of 24 June 2026, providing investors with the latest insights into its performance and outlook.
Read full news article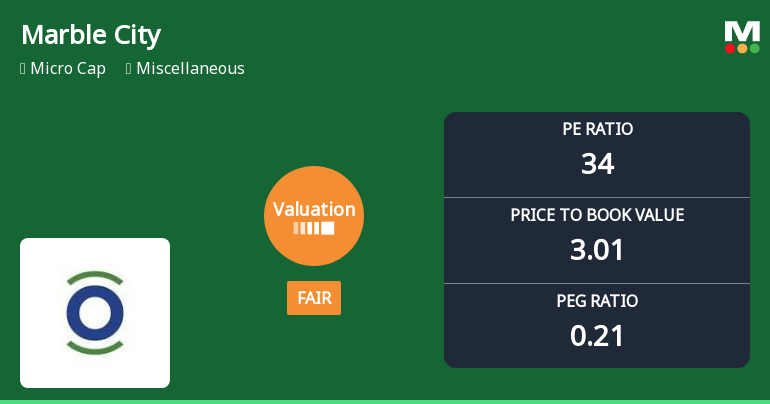
Marble City India Ltd Valuation Shifts to Fair Amid Mixed Market Performance
Marble City India Ltd, a micro-cap player in the miscellaneous sector, has seen a notable shift in its valuation parameters, moving from an attractive to a fair rating. Despite a modest day change of 0.23%, the company’s price-to-earnings (P/E) and price-to-book value (P/BV) ratios have evolved, reflecting changing investor sentiment and market dynamics. This article analyses these valuation changes in the context of historical trends, peer comparisons, and broader market performance.
Read full news article Announcements
Closure of Trading Window
26-Jun-2026 | Source : BSEIntimation for Closure of Trading Window for the Quarter Ended 30.06.2026
Clarification sought from Marble City India Ltd
23-Jun-2026 | Source : BSEThe Exchange has sought clarification from Marble City India Ltd on June 23 2026 with reference to significant movement in price in order to ensure that investors have latest relevant information about the company and to inform the market so that the interest of the investors is safeguarded.
The reply is awaited.
Shareholder Meeting / Postal Ballot-Outcome of EGM
10-Jun-2026 | Source : BSEOutcome of Extra Ordinary General Meeting held on 10th June 2026.
Corporate Actions

No Upcoming Board Meetings

Marble City India Ltd has declared 5% dividend, ex-date: To Be Announced

Marble City India Ltd has announced 5:10 stock split, ex-date: 14 Oct 19

No Bonus history available

No Rights history available
Quality key factors
Valuation key factors
Technicals key factors
 Technical Indicator Scale: Bearish, Mildly Bearish, Sideways, Mildly Bullish, Bullish Turned
 Shareholding Snapshot : Mar 2026
Shareholding Compare (%holding)
Non Institution
None
Held by 2 Schemes (1.14%)
Held by 0 FIIs
Reven Distributors Private Limited (19.0%)
Psh Constructions Private Limited (15.23%)
16.84%
Quarterly Results Snapshot (Standalone) - Mar'26 - QoQ

QoQ Growth in quarter ended Mar 2026 is 50.03% vs -11.39% in Dec 2025

QoQ Growth in quarter ended Mar 2026 is -58.00% vs -26.47% in Dec 2025
Half Yearly Results Snapshot (Standalone) - Sep'25
Growth in half year ended Sep 2025 is 126.24% vs -50.90% in Sep 2024
Growth in half year ended Sep 2025 is 220.92% vs -1,186.36% in Sep 2024
Nine Monthly Results Snapshot (Standalone) - Dec'25
YoY Growth in nine months ended Dec 2025 is 61.93% vs -13.61% in Dec 2024
YoY Growth in nine months ended Dec 2025 is 278.44% vs -257.38% in Dec 2024
Annual Results Snapshot (Standalone) - Mar'26
YoY Growth in year ended Mar 2026 is 33.10% vs 28.57% in Mar 2025
YoY Growth in year ended Mar 2026 is 80.67% vs 222.05% in Mar 2025
About Marble City India Ltd

Company Coordinates


