
Compare Impex Ferro Tech with Similar Stocks
Dashboard
With a Negative Book Value, the company has a Weak Long Term Fundamental Strength
- Poor long term growth as Net Sales has grown by an annual rate of -100.00% and Operating profit at 0% over the last 5 years
- The company has a negative book value of Rs 315.21 crore
Flat results in Dec 25
Risky - Negative EBITDA
Consistent Underperformance against the benchmark over the last 3 years
Stock DNA
Ferrous Metals
INR 16 Cr (Micro Cap)
NA (Loss Making)
23
0.00%
-0.85
2.32%
-0.05
Total Returns (Price + Dividend) 
Impex Ferro Tech for the last several years.
Risk Adjusted Returns v/s
Returns Beta

News

Impex Ferro Tech Ltd Locks at Lower Circuit With 4.52% Loss — Sellers Queue, No Buyers in Sight
At Rs 1.69, sellers were still queuing — but there were no buyers willing to take the other side. Impex Ferro Tech Ltd locked at its lower circuit of 4.52% on 6 May 2026, with unfilled sell orders and a frozen price, reflecting persistent selling pressure in a micro-cap stock with limited liquidity.
Read full news article
Impex Ferro Tech Ltd Locks at Lower Circuit With 4.7% Loss — Sellers Queue, No Buyers in Sight
At Rs 1.63, sellers were still queuing — but there were no buyers willing to take the other side. Impex Ferro Tech Ltd locked at its lower circuit of 4.68% on 4 May 2026, with unfilled sell orders and a frozen price, reflecting persistent selling pressure in a micro-cap stock with limited liquidity.
Read full news article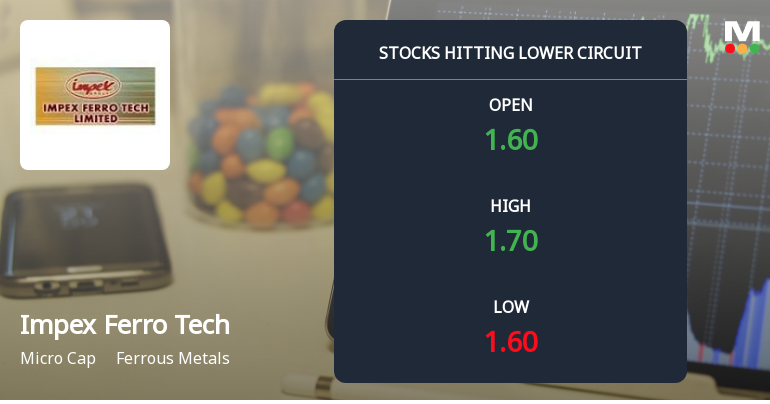
Impex Ferro Tech Ltd Locks at Lower Circuit With 4.79% Loss — Sellers Queue, No Buyers in Sight
At Rs 1.59, Impex Ferro Tech Ltd locked at its lower circuit on 24 Apr 2026, falling 4.79% within a 5% price band. Despite the decline, sellers remained lined up with no buyers willing to absorb the supply, resulting in a frozen price and unfilled sell orders throughout the session.
Read full news article Announcements
Corporate Insolvency Resolution Process (CIRP)-Outcome of meeting of Committee of Creditors
09-Mar-2026 | Source : BSEOutcome of 25th CoC
Corporate Insolvency Resolution Process (CIRP)-Intimation of meeting of Committee of Creditors
05-Mar-2026 | Source : BSEIntimation of 25th CoC
Corporate Insolvency Resolution Process (CIRP)-Outcome of meeting of Committee of Creditors
21-Feb-2026 | Source : BSEOutcome of 24th CoC
Corporate Actions

No Upcoming Board Meetings

No Dividend history available

No Splits history available

No Bonus history available

Impex Ferro Tech Ltd has announced 1:1 rights issue, ex-date: 17 Sep 09
Quality key factors
Valuation key factors
Technicals key factors
 Technical Indicator Scale: Bearish, Mildly Bearish, Sideways, Mildly Bullish, Bullish Turned
 Shareholding Snapshot : Mar 2025
Shareholding Compare (%holding)
Promoters
100
Held by 0 Schemes
Held by 0 FIIs
Suanvi Trading & Investment Company Pvt.ltd (17.14%)
None
27.2%
Quarterly Results Snapshot (Standalone) - Dec'25 - QoQ
QoQ Growth in quarter ended Dec 2025 is 0.00% vs 0.00% in Sep 2025

QoQ Growth in quarter ended Dec 2025 is 0.00% vs 3.21% in Sep 2025
Half Yearly Results Snapshot (Standalone) - Sep'25
Growth in half year ended Sep 2025 is -100.00% vs -91.57% in Sep 2024
Growth in half year ended Sep 2025 is -7.60% vs 41.44% in Sep 2024
Nine Monthly Results Snapshot (Standalone) - Dec'25
YoY Growth in nine months ended Dec 2025 is -100.00% vs -93.09% in Dec 2024
YoY Growth in nine months ended Dec 2025 is -4.57% vs 43.97% in Dec 2024
Annual Results Snapshot (Standalone) - Mar'25
YoY Growth in year ended Mar 2025 is -99.24% vs -80.82% in Mar 2024

YoY Growth in year ended Mar 2025 is 76.30% vs 11.22% in Mar 2024
About Impex Ferro Tech Ltd

Company Coordinates


