
Compare Eimco Elecon(I) with Similar Stocks
Dashboard
Negative results in Mar 26
- PAT(Q) At Rs 6.36 cr has Fallen at -46.1% (vs previous 4Q average)
- ROCE(HY) Lowest at 10.85%
With ROE of 8.3, it has a Very Expensive valuation with a 2.1 Price to Book Value
Despite the size of the company, domestic mutual funds hold only 0% of the company
Underperformed the market in the last 1 year
Stock DNA
Industrial Manufacturing
INR 1,041 Cr (Micro Cap)
26.00
39
0.22%
-0.02
8.28%
2.21
Total Returns (Price + Dividend) 
Latest dividend: 3.9998700454840805 per share ex-dividend date: Jun-12-2026
Risk Adjusted Returns v/s
Returns Beta

News
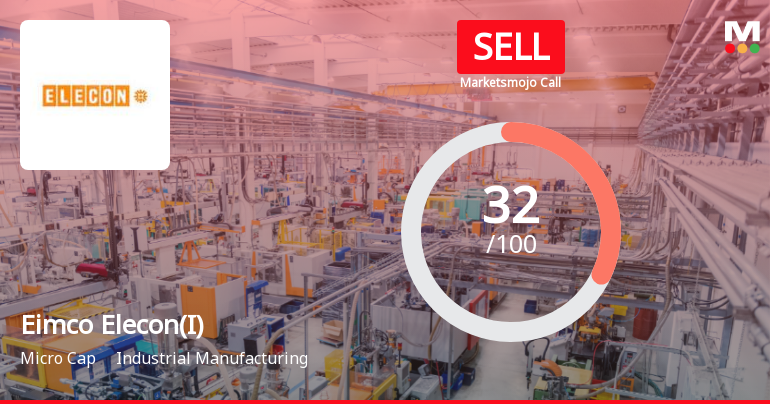
Eimco Elecon (India) Ltd Downgraded to Sell Amid Mixed Technicals and Valuation Concerns
Eimco Elecon (India) Ltd has seen its investment rating upgraded from Strong Sell to Sell, reflecting a nuanced shift in technical indicators despite persistent valuation concerns and recent financial setbacks. The revision, effective 23 June 2026, stems from changes across four key parameters: quality, valuation, financial trend, and technicals, each presenting a complex picture for investors navigating this micro-cap industrial manufacturing stock.
Read full news article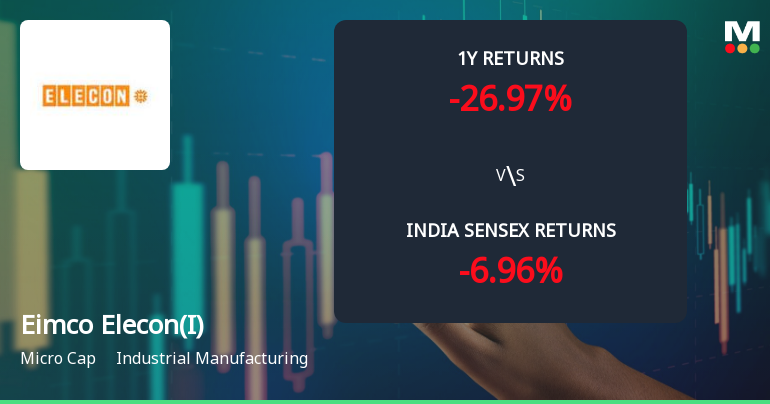
Eimco Elecon (India) Ltd Technical Momentum Shifts Amid Mixed Market Signals
Eimco Elecon (India) Ltd, a micro-cap player in the industrial manufacturing sector, has experienced a notable shift in its technical momentum, moving from a mildly bearish stance to a sideways trend. Despite a recent downgrade in its Mojo Grade from Strong Sell to Sell, the stock exhibits a complex interplay of technical indicators, reflecting both bullish and bearish signals across different timeframes.
Read full news article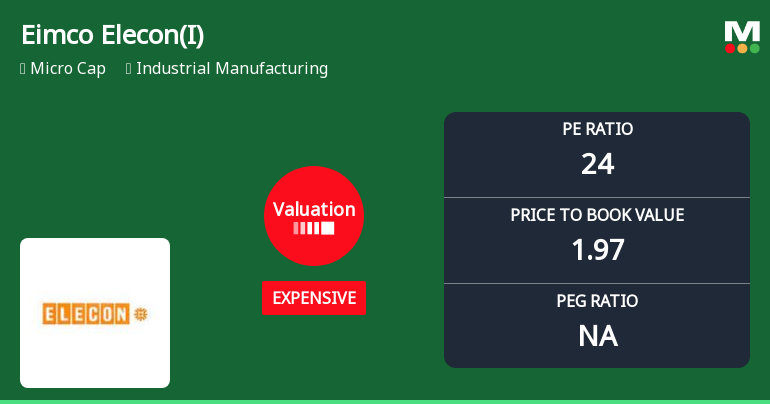
Eimco Elecon (India) Ltd Valuation Shifts Signal Price Attractiveness Change
Eimco Elecon (India) Ltd, a micro-cap player in the industrial manufacturing sector, has experienced a notable shift in its valuation parameters, moving from a 'very expensive' to an 'expensive' rating. Despite a strong long-term return profile, recent price-to-earnings and price-to-book value metrics suggest a more cautious stance for investors amid mixed short-term performance and a downgrade in its Mojo Grade to Strong Sell.
Read full news article Announcements
Proceedings Of 52Nd Annual General Meeting Of The Company
25-Jun-2026 | Source : BSEProceedings of 52nd Annual General Meeting
Chairmans Statement
25-Jun-2026 | Source : BSEAs per attachment
Announcement under Regulation 30 (LODR)-Newspaper Publication
09-Jun-2026 | Source : BSEAs per the attachment
Corporate Actions

No Upcoming Board Meetings

Eimco Elecon (India) Ltd has declared 40% dividend, ex-date: 12 Jun 26

No Splits history available

No Bonus history available

No Rights history available
Quality key factors
Valuation key factors
Technicals key factors
 Technical Indicator Scale: Bearish, Mildly Bearish, Sideways, Mildly Bullish, Bullish Turned
 Shareholding Snapshot : Mar 2026
Shareholding Compare (%holding)
Promoters
None
Held by 0 Schemes
Held by 27 FIIs (3.1%)
Aakaaish Investments Private Limited (24.91%)
Aegis Investment Fund Pcc (2.32%)
35.72%
Quarterly Results Snapshot (Standalone) - Mar'26 - QoQ

QoQ Growth in quarter ended Mar 2026 is 6.06% vs 89.71% in Dec 2025
QoQ Growth in quarter ended Mar 2026 is -49.20% vs 134.02% in Dec 2025
Half Yearly Results Snapshot (Standalone) - Sep'25
Growth in half year ended Sep 2025 is -26.07% vs 43.63% in Sep 2024
Growth in half year ended Sep 2025 is -28.77% vs 54.41% in Sep 2024
Nine Monthly Results Snapshot (Standalone) - Dec'25
YoY Growth in nine months ended Dec 2025 is -10.06% vs 27.24% in Dec 2024
YoY Growth in nine months ended Dec 2025 is -4.94% vs 33.03% in Dec 2024
Annual Results Snapshot (Standalone) - Mar'26
YoY Growth in year ended Mar 2026 is -6.38% vs 8.34% in Mar 2025
YoY Growth in year ended Mar 2026 is -20.85% vs 21.03% in Mar 2025
About Eimco Elecon (India) Ltd

Company Coordinates


