
Compare GE Vernova T&D with Similar Stocks
Dashboard
High Management Efficiency with a high ROE of 16.31%
Strong ability to service debt as the company has a low Debt to EBITDA ratio of 0.03 times
Healthy long term growth as Operating profit has grown by an annual rate 83.13%
With a growth in Net Profit of 88.63%, the company declared Very Positive results in Mar 26
High Institutional Holdings at 41.78%
Company is among the highest 1% of companies rated by MarketsMojo across all 4,000 stocks
Stock DNA
Heavy Electrical Equipment
INR 136,999 Cr (Mid Cap)
110.00
48
0.09%
-0.41
61.38%
67.71
Total Returns (Price + Dividend) 
Latest dividend: 5 per share ex-dividend date: Aug-22-2025
Risk Adjusted Returns v/s
Returns Beta

News

143% Stock Return vs 110% Profit Growth: What Drives GE Vernova T&D India Ltd’s Multibagger Rally?
A 143.08% stock return in one year. An 110.5% growth in net profit over the same period. The gap between those two numbers — roughly 33 percentage points — is driven by the market's willingness to pay more for each rupee of GE Vernova T&D India Ltd's earnings. That willingness is the story behind this mid-cap's rerating.
Read full news article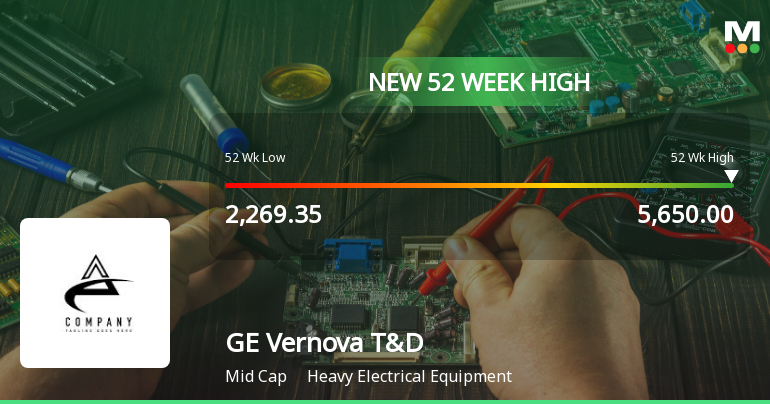
Broad-Based Technical Strength Lifts GE Vernova T&D India Ltd to 52-Week High of Rs 5650
Surging past its previous peaks, GE Vernova T&D India Ltd touched a new 52-week high of Rs 5650 on 23 Jun 2026, marking a remarkable 143.53% gain over the past year. This milestone reflects a powerful convergence of technical momentum and sustained earnings growth that has propelled the stock well ahead of the broader market.
Read full news article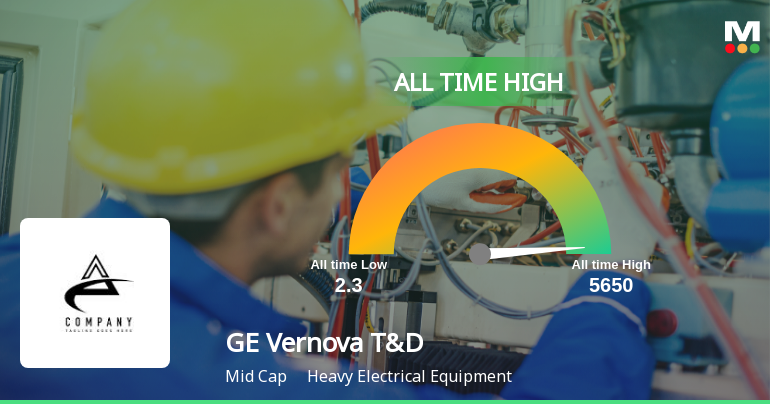
Announcements
Disclosures under Reg. 29(2) of SEBI (SAST) Regulations 2011
19-Jun-2026 | Source : BSEThe Exchange has received the disclosure under Regulation 29(2) of SEBI (Substantial Acquisition of Shares & Takeovers) Regulations 2011 for Nippon India Mutual Fund
Announcement under Regulation 30 (LODR)-Newspaper Publication
10-Jun-2026 | Source : BSENewspaper Advertisement w.r.t opening of Special Window for Transfer and Dematerialisation of Physical Shares
Announcement under Regulation 30 (LODR)-Investor Presentation
01-Jun-2026 | Source : BSEInvestor Presentation
Corporate Actions

No Upcoming Board Meetings

GE Vernova T&D India Ltd has declared 500% dividend, ex-date: 21 Aug 26

GE Vernova T&D India Ltd has announced 2:10 stock split, ex-date: 22 Oct 08

No Bonus history available

No Rights history available
Quality key factors
Valuation key factors
Technicals key factors
 Technical Indicator Scale: Bearish, Mildly Bearish, Sideways, Mildly Bullish, Bullish Turned
 Shareholding Snapshot : Mar 2026
Shareholding Compare (%holding)
Promoters
None
Held by 39 Schemes (18.03%)
Held by 848 FIIs (20.39%)
Grid Equipments Private Limited (50.7%)
Kotak Midcap Fund (4.28%)
5.36%
Quarterly Results Snapshot (Standalone) - Mar'26 - YoY

YoY Growth in quarter ended Mar 2026 is 42.04% vs 26.15% in Mar 2025

YoY Growth in quarter ended Mar 2026 is 88.63% vs 181.32% in Mar 2025
Half Yearly Results Snapshot (Standalone) - Sep'25
Growth in half year ended Sep 2025 is 38.84% vs 45.98% in Sep 2024
Growth in half year ended Sep 2025 is 111.59% vs 326.78% in Sep 2024
Nine Monthly Results Snapshot (Standalone) - Dec'25
YoY Growth in nine months ended Dec 2025 is 45.53% vs 39.28% in Dec 2024
YoY Growth in nine months ended Dec 2025 is 108.96% vs 267.58% in Dec 2024
Annual Results Snapshot (Standalone) - Mar'26
YoY Growth in year ended Mar 2026 is 44.59% vs 35.49% in Mar 2025
YoY Growth in year ended Mar 2026 is 102.73% vs 236.00% in Mar 2025
About GE Vernova T&D India Ltd

Company Coordinates


