
Compare IFB Industries with Similar Stocks
Dashboard
Company has a Debt to Equity ratio (avg) of 0.06 times
With a growth in Net Profit of 62.13%, the company declared Very Positive results in Mar 26
With ROE of 15.5, it has a Very Attractive valuation with a 5.2 Price to Book Value
Majority shareholders : Promoters
Underperformed the market in the last 1 year
Stock DNA
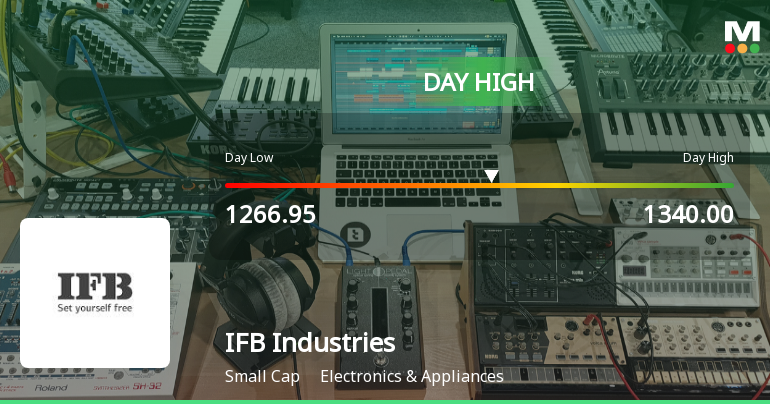
Electronics & Appliances
INR 5,222 Cr (Small Cap)
34.00
53
0.00%
-0.23
15.49%
5.25
Total Returns (Price + Dividend) 
IFB Industries for the last several years.
Risk Adjusted Returns v/s
Returns Beta

News
IFB Industries Ltd Surges 7.46% to Day's High of Rs 1321.25 — Outperforms Sector by 4.87 Percentage Points
The Sensex advanced 1.09% on 12 Jun 2026, yet IFB Industries Ltd outpaced the broader market with a 7.46% gain, reaching an intraday peak of Rs 1321.25. This 4.87 percentage-point outperformance over the Electronics & Appliances sector’s 2.19% rise highlights a distinctly stock-specific rally that rewrites the short-term narrative for this small-cap player.
Read full news article
IFB Industries Ltd is Rated Hold by MarketsMOJO
IFB Industries Ltd is rated 'Hold' by MarketsMOJO, with this rating last updated on 26 May 2026. However, the analysis and financial metrics discussed here reflect the stock's current position as of 08 June 2026, providing investors with an up-to-date view of the company’s fundamentals, valuation, financial trends, and technical outlook.
Read full news article
IFB Industries Ltd is Rated Hold by MarketsMOJO
IFB Industries Ltd is rated 'Hold' by MarketsMOJO, with this rating last updated on 26 May 2026. However, the analysis and financial metrics discussed here reflect the stock's current position as of 08 June 2026, providing investors with an up-to-date view of the company’s fundamentals, returns, and market standing.
Read full news article Announcements
Announcement under Regulation 30 (LODR)-Earnings Call Transcript
15-Jun-2026 | Source : BSETranscript of the earnings conference call for the Quarter and Financial Year ended 31st March 2026
Announcement under Regulation 30 (LODR)-Newspaper Publication
11-Jun-2026 | Source : BSENewspaper Publication pertaining to Special Window for Transfer and Dematerialisation of Physical Securities introduced by Securities and Exchange Board of India (SEBI)
Announcement under Regulation 30 (LODR)-Analyst / Investor Meet - Outcome
10-Jun-2026 | Source : BSEPursuant to the provisions of Regulation 30 read with Part A of Schedule III of the SEBI (Listing Obligations and Disclosure Requirements) Regulations 2015 and other applicable provisions of SEBI (LODR) Regulations 2015 we hereby inform that the Audio Recording of the Investors Call hosted by the Company for the Audited Financial Results of the company for the Quarter and Financial Year ended 31st March 2026 conducted through conference call on Wednesday 10th June 2026 at 04:00 P.M. (IST) is now available on the Companys website at the following link: https://www.ifbindustries.com/financial.php
Corporate Actions

No Upcoming Board Meetings

No Dividend history available

No Splits history available

No Bonus history available

No Rights history available
Quality key factors
Valuation key factors
Technicals key factors
 Technical Indicator Scale: Bearish, Mildly Bearish, Sideways, Mildly Bullish, Bullish Turned
 Shareholding Snapshot : Mar 2026
Shareholding Compare (%holding)
Promoters
None
Held by 16 Schemes (5.5%)
Held by 36 FIIs (0.92%)
Ifb Automotive Private Limited (46.54%)
Dsp Small Cap Fund (4.66%)
12.65%
Quarterly Results Snapshot (Consolidated) - Mar'26 - YoY

YoY Growth in quarter ended Mar 2026 is 12.33% vs 22.34% in Mar 2025

YoY Growth in quarter ended Mar 2026 is 126.13% vs 57.25% in Mar 2025
Half Yearly Results Snapshot (Consolidated) - Sep'25
Growth in half year ended Sep 2025 is 8.85% vs 13.80% in Sep 2024
Growth in half year ended Sep 2025 is 11.60% vs 229.75% in Sep 2024
Nine Monthly Results Snapshot (Consolidated) - Dec'25
YoY Growth in nine months ended Dec 2025 is 9.67% vs 12.26% in Dec 2024
YoY Growth in nine months ended Dec 2025 is 0.85% vs 160.79% in Dec 2024
Annual Results Snapshot (Consolidated) - Mar'26
YoY Growth in year ended Mar 2026 is 10.37% vs 14.73% in Mar 2025
YoY Growth in year ended Mar 2026 is 20.73% vs 136.12% in Mar 2025
About IFB Industries Ltd

Company Coordinates


