
Compare MKVentures Cap. with Similar Stocks
Stock DNA
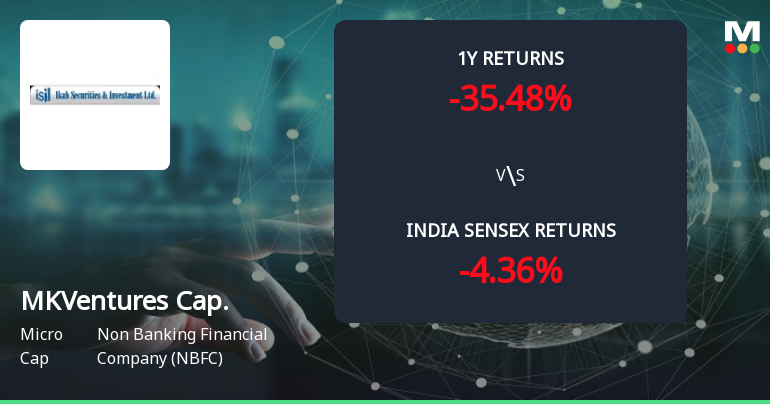
Non Banking Financial Company (NBFC)
INR 421 Cr (Micro Cap)
41.00
21
0.04%
0.00
9.35%
3.71
Total Returns (Price + Dividend) 
Latest dividend: 0.20040659340659342 per share ex-dividend date: Jun-05-2026
Risk Adjusted Returns v/s
Returns Beta

News
Golden Cross Forms in MKVentures Capital Ltd — Mixed Technical Signals Cloud the Outlook
The 50-day moving average has crossed above the 200-day moving average for MKVentures Capital Ltd, signalling a golden cross on 30 Jul 2026. Yet, the stock’s recent price action and monthly technical indicators present a more nuanced picture, raising questions about the reliability of this signal in isolation.
Read full news article
MKVentures Capital Ltd is Rated Strong Sell
MKVentures Capital Ltd is rated Strong Sell by MarketsMOJO. This rating was last updated on 18 Nov 2025. However, the analysis and financial metrics discussed below reflect the stock’s current position as of 25 July 2026, providing investors with the latest insights into the company’s performance and outlook.
Read full news article
MKVentures Capital Ltd is Rated Strong Sell
MKVentures Capital Ltd is rated Strong Sell by MarketsMOJO. This rating was last updated on 18 Nov 2025. However, the analysis and financial metrics discussed below reflect the company’s current position as of 14 July 2026, providing investors with the latest insights into its performance and outlook.
Read full news article Announcements
Compliances-Certificate under Reg. 74 (5) of SEBI (DP) Regulations 2018
09-Jul-2026 | Source : BSEPlease find enclosed Compliance Certificate under Reg 74(5) for June Quarter.
Shareholder Meeting / Postal Ballot-Scrutinizers Report
06-Jul-2026 | Source : BSEPlease find attached herewith Scrutinizer Report.
Shareholder Meeting / Postal Ballot-Outcome of Postal_Ballot
06-Jul-2026 | Source : BSEPlease find attached herewith postal ballot Outcome
Corporate Actions

No Upcoming Board Meetings

MKVentures Capital Ltd has declared 2% dividend, ex-date: 05 Jun 26

No Splits history available

No Bonus history available

MKVentures Capital Ltd has announced 1:8 rights issue, ex-date: 03 Apr 23
Quality key factors
Valuation key factors
Technicals key factors
 Technical Indicator Scale: Bearish, Mildly Bearish, Sideways, Mildly Bullish, Bullish Turned
 Shareholding Snapshot : Jun 2026
Shareholding Compare (%holding)
Promoters
None
Held by 0 Schemes
Held by 1 FIIs (4.26%)
Madhusudan Murlidhar Kela (74.36%)
Think India Opportunities Master Fund Lp (4.26%)
17.52%
Quarterly Results Snapshot (Consolidated) - Mar'26 - QoQ

QoQ Growth in quarter ended Mar 2026 is -35.96% vs -41.35% in Dec 2025

QoQ Growth in quarter ended Mar 2026 is -79.83% vs -33.62% in Dec 2025
Half Yearly Results Snapshot (Consolidated) - Sep'25
Growth in half year ended Sep 2025 is -16.38% vs -34.76% in Sep 2024
Growth in half year ended Sep 2025 is -17.11% vs -8.20% in Sep 2024
Nine Monthly Results Snapshot (Consolidated) - Dec'25
YoY Growth in nine months ended Dec 2025 is -29.87% vs -27.07% in Dec 2024
YoY Growth in nine months ended Dec 2025 is -31.55% vs -3.14% in Dec 2024
Annual Results Snapshot (Consolidated) - Mar'26
YoY Growth in year ended Mar 2026 is -28.85% vs -35.43% in Mar 2025
YoY Growth in year ended Mar 2026 is 11.80% vs -55.17% in Mar 2025
About MKVentures Capital Ltd

Company Coordinates


