
Compare Dhanlaxmi Fabric with Similar Stocks
Dashboard
With a Operating Losses, the company has a Weak Long Term Fundamental Strength
- Company's ability to service its debt is weak with a poor EBIT to Interest (avg) ratio of -2.90
- The company has been able to generate a Return on Equity (avg) of 0.44% signifying low profitability per unit of shareholders funds
Risky - Negative EBITDA
Below par performance in long term as well as near term
Stock DNA
Garments & Apparels
INR 44 Cr (Micro Cap)
NA (Loss Making)
25
0.00%
-0.01
-5.06%
1.01
Total Returns (Price + Dividend) 
Latest dividend: 0.3500 per share ex-dividend date: Sep-11-2008
Risk Adjusted Returns v/s
Returns Beta

News

Dhanlaxmi Fabrics Ltd is Rated Strong Sell
Dhanlaxmi Fabrics Ltd is rated Strong Sell by MarketsMOJO. This rating was last updated on 20 Apr 2026, reflecting a reassessment of the stock’s outlook. However, the analysis and financial metrics discussed below are based on the company’s current position as of 15 July 2026, providing investors with the latest insights into its performance and prospects.
Read full news article
Dhanlaxmi Fabrics Ltd is Rated Strong Sell
Dhanlaxmi Fabrics Ltd is rated Strong Sell by MarketsMOJO. This rating was last updated on 20 Apr 2026, reflecting a significant reassessment of the stock’s outlook. However, all fundamentals, returns, and financial metrics discussed below are current as of 01 July 2026, providing investors with the latest comprehensive view of the company’s position.
Read full news article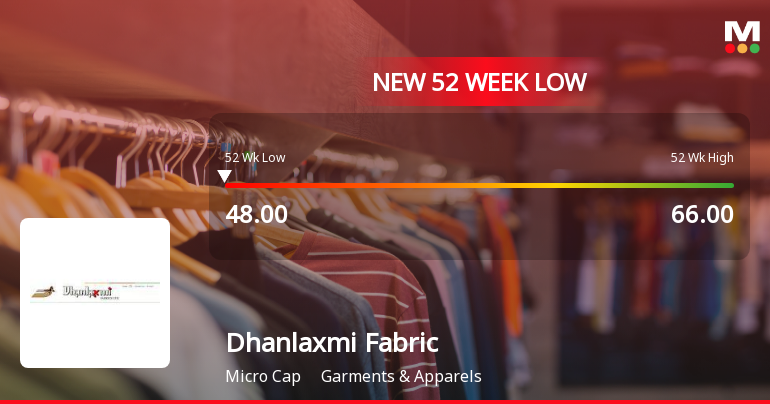
Dhanlaxmi Fabrics Ltd Falls to 52-Week Low of Rs 48 as Sell-Off Deepens
A sharp decline has pushed Dhanlaxmi Fabrics Ltd to a fresh 52-week low of Rs 48 on 24 Jun 2026, marking a significant 27.3% drop from its 52-week high of Rs 66. This fall comes amid persistent underperformance relative to the broader market and sector gains, signalling mounting pressure on the micro-cap textile player.
Read full news article Announcements
Compliances-Certificate under Reg. 74 (5) of SEBI (DP) Regulations 2018
13-Jul-2026 | Source : BSEEnclosed herewith Certificate under Regulation 74(5) of SEBI (Depositories & Participants) Regulations 2018 for the quarter ended 30th June 2026
Closure of Trading Window
23-Jun-2026 | Source : BSEIntimation for Closure of Trading Window
Board Meeting Outcome for Outcome Of Board Meeting Held On 30.05.2026
30-May-2026 | Source : BSEOutcome of Board meeting held on 30.05.2026
Corporate Actions

No Upcoming Board Meetings

Dhanlaxmi Fabrics Ltd has declared 5% dividend, ex-date: 11 Sep 08

No Splits history available

No Bonus history available

No Rights history available
Quality key factors
Valuation key factors
Technicals key factors
 Technical Indicator Scale: Bearish, Mildly Bearish, Sideways, Mildly Bullish, Bullish Turned
 Shareholding Snapshot : Mar 2026
Shareholding Compare (%holding)
Promoters
None
Held by 0 Schemes
Held by 0 FIIs
Vinod Sohanlal Jhawar (17.84%)
Eskay Niryat Pvt Ltd (14.92%)
7.62%
Quarterly Results Snapshot (Consolidated) - Mar'26 - QoQ

QoQ Growth in quarter ended Mar 2026 is -42.76% vs 202.08% in Dec 2025
QoQ Growth in quarter ended Mar 2026 is -2,428.57% vs 94.66% in Dec 2025
Half Yearly Results Snapshot (Consolidated) - Sep'25

Growth in half year ended Sep 2025 is -8.62% vs -27.63% in Sep 2024
Growth in half year ended Sep 2025 is -4,800.00% vs 99.10% in Sep 2024
Nine Monthly Results Snapshot (Consolidated) - Dec'25
YoY Growth in nine months ended Dec 2025 is 94.84% vs -34.18% in Dec 2024
YoY Growth in nine months ended Dec 2025 is 0.00% vs 100.00% in Dec 2024
Annual Results Snapshot (Consolidated) - Mar'26
YoY Growth in year ended Mar 2026 is 86.04% vs -34.22% in Mar 2025
YoY Growth in year ended Mar 2026 is -3,766.67% vs 101.17% in Mar 2025
About Dhanlaxmi Fabrics Ltd

Company Coordinates


