
Compare Lupin with Similar Stocks
Dashboard
Company has a Debt to Equity ratio (avg) of 0.11 times
Healthy long term growth as Net Sales has grown by an annual rate of 13.02% and Operating profit at 34.70%
With a growth in Net Profit of 24.41%, the company declared Very Positive results in Mar 26
With ROE of 25.7, it has a Very Attractive valuation with a 4.9 Price to Book Value
High Institutional Holdings at 47.03%
Stock DNA
Pharmaceuticals & Biotechnology
INR 109,589 Cr (Mid Cap)
19.00
27
0.50%
-0.12
25.68%
4.88
Total Returns (Price + Dividend) 
Latest dividend: 12 per share ex-dividend date: Jul-25-2025
Risk Adjusted Returns v/s
Returns Beta

News

Lupin Ltd. Upgraded to Strong Buy on Robust Valuation and Financial Performance
Lupin Ltd., a prominent player in the Pharmaceuticals & Biotechnology sector, has been upgraded from a Buy to a Strong Buy rating by MarketsMojo as of 1 July 2026. This upgrade reflects significant improvements across valuation, financial trends, quality metrics, and technical indicators, positioning the mid-cap stock as a compelling investment opportunity amid a challenging market backdrop.
Read full news article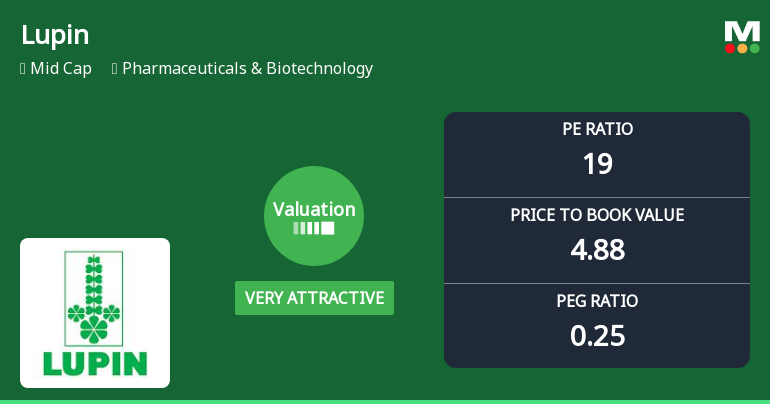
Lupin Ltd. Valuation Shifts to Very Attractive Amid Strong Market Outperformance
Lupin Ltd., a prominent player in the Pharmaceuticals & Biotechnology sector, has witnessed a significant improvement in its valuation parameters, prompting an upgrade to a Strong Buy rating. The company’s price-to-earnings (P/E) ratio and price-to-book value (P/BV) have shifted from attractive to very attractive levels, underscoring enhanced price attractiveness relative to historical and peer benchmarks. This development comes amid robust financial metrics and a compelling growth trajectory that outpaces the broader market.
Read full news article
Lupin Ltd. is Rated Buy by MarketsMOJO
Lupin Ltd. is rated 'Buy' by MarketsMOJO, with this rating last updated on 25 May 2026. While the rating was revised on that date, the analysis and financial metrics presented here reflect the stock's current position as of 30 June 2026, providing investors with an up-to-date view of the company’s fundamentals, returns, and technical outlook.
Read full news article Announcements
Announcement under Regulation 30 (LODR)-Allotment of ESOP / ESPS
30-Jun-2026 | Source : BSEIntimation regarding Grant of 65251 Stock Options under Lupin Employees Stock Option Scheme 2025.
Closure of Trading Window
26-Jun-2026 | Source : BSEIntimation of Closure of Trading Window.
Announcement under Regulation 30 (LODR)-Press Release / Media Release
26-Jun-2026 | Source : BSELupin Receives Tentative Approval from U.S. FDA for Enzalutamide Tablets.
Corporate Actions

No Upcoming Board Meetings

Lupin Ltd. has declared 600% dividend, ex-date: 25 Jul 25

Lupin Ltd. has announced 2:10 stock split, ex-date: 27 Aug 10

Lupin Ltd. has announced 1:1 bonus issue, ex-date: 11 Aug 06

No Rights history available
Quality key factors
Valuation key factors
Technicals key factors
 Technical Indicator Scale: Bearish, Mildly Bearish, Sideways, Mildly Bullish, Bullish Turned
 Shareholding Snapshot : Mar 2026
Shareholding Compare (%holding)
Promoters
None
Held by 41 Schemes (16.93%)
Held by 872 FIIs (21.71%)
Lupin Investments Private Limited (45.32%)
Hdfc Trustee Company Ltd. A/c Hdfc Balanced Advantage Fund (4.58%)
5.05%
Quarterly Results Snapshot (Consolidated) - Mar'26 - QoQ

QoQ Growth in quarter ended Mar 2026 is 4.29% vs 1.70% in Dec 2025
QoQ Growth in quarter ended Mar 2026 is 24.23% vs -20.46% in Dec 2025
Half Yearly Results Snapshot (Consolidated) - Sep'25
Growth in half year ended Sep 2025 is 18.12% vs 14.42% in Sep 2024

Growth in half year ended Sep 2025 is 63.06% vs 75.59% in Sep 2024
Nine Monthly Results Snapshot (Consolidated) - Dec'25
YoY Growth in nine months ended Dec 2025 is 20.20% vs 13.23% in Dec 2024
YoY Growth in nine months ended Dec 2025 is 54.34% vs 61.35% in Dec 2024
Annual Results Snapshot (Consolidated) - Mar'26
YoY Growth in year ended Mar 2026 is 23.12% vs 13.48% in Mar 2025
YoY Growth in year ended Mar 2026 is 62.51% vs 71.41% in Mar 2025
About Lupin Ltd.

Company Coordinates


