
Compare Zee Entertainmen with Similar Stocks
Dashboard
Poor long term growth as Operating profit has grown by an annual rate -32.85% of over the last 5 years
With a fall in Net Sales of -11.2%, the company declared Very Negative results in Mar 26
With ROE of 2.4, it has a Very Expensive valuation with a 0.9 Price to Book Value
Consistent Underperformance against the benchmark over the last 3 years
Stock DNA
Media & Entertainment
INR 11,190 Cr (Small Cap)
39.00
19
2.16%
-0.21
2.38%
0.92
Total Returns (Price + Dividend) 
Latest dividend: 2.43 per share ex-dividend date: Aug-29-2025
Risk Adjusted Returns v/s
Returns Beta

News
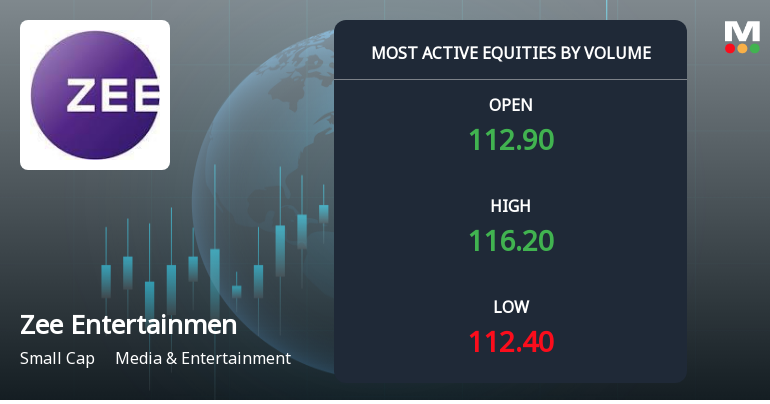
Zee Entertainment Sees Exceptional Volume Surge Amid Positive Momentum
Zee Entertainment Enterprises Ltd (ZEEL) has emerged as one of the most actively traded stocks in the Media & Entertainment sector, registering a remarkable surge in volume and price momentum. The stock outperformed its sector peers and the broader Sensex, driven by heightened investor participation and sustained buying interest over recent sessions.
Read full news article
Zee Entertainment Enterprises Ltd is Rated Sell
Zee Entertainment Enterprises Ltd is rated 'Sell' by MarketsMOJO, with this rating last updated on 29 May 2026. However, the analysis and financial metrics discussed here reflect the stock's current position as of 26 July 2026, providing investors with an up-to-date perspective on the company’s fundamentals, valuation, financial trend, and technical outlook.
Read full news article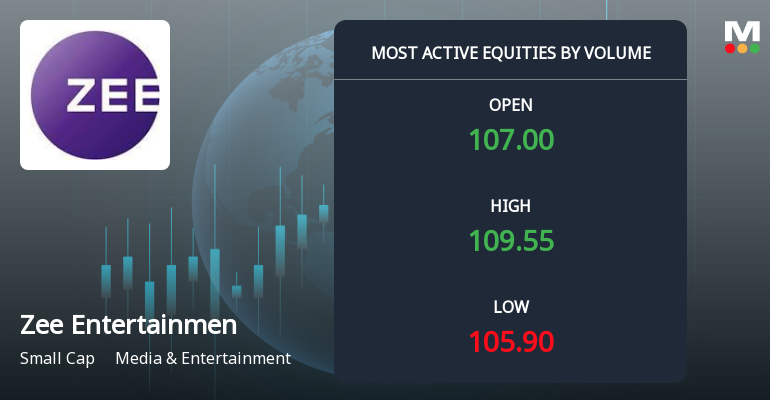
Zee Entertainment Sees Exceptional Volume Surge Amid Positive Momentum
Zee Entertainment Enterprises Ltd (ZEEL) has emerged as one of the most actively traded stocks by volume on 20 July 2026, registering a significant surge in trading activity that coincides with a sustained upward price trend. The stock outperformed its sector and broader market indices, signalling renewed investor interest despite a recent downgrade in its Mojo Grade.
Read full news article Announcements
Disclosure Under Regulation 30 Of The SEBI (Listing Obligations And Disclosure Requirements) Regulations 2015- Redemption Of Fccbs
18-Jul-2026 | Source : BSEDisclosure under Regulation 30 of the SEBI (Listing Obligations and Disclosure Requirements) Regulations 2015- Redemption of FCCBs
Compliances-Certificate under Reg. 74 (5) of SEBI (DP) Regulations 2018
15-Jul-2026 | Source : BSECertificate under Regulation 74(5) of SEBI (DP) Regulations 2018 for the quarter ended June 30 2026.
Disclosure Under Regulation 30 Of The SEBI (Listing Obligations And Disclosure Requirements) Regulations 2015- Redemption And Cancellation Of Fccbs
13-Jul-2026 | Source : BSEDisclosure under Regulation 30 of the SEBI (LODR) Regulations 2015- Redemption and Cancellation of FCCBs
Corporate Actions

No Upcoming Board Meetings

Zee Entertainment Enterprises Ltd has declared 243% dividend, ex-date: 29 Aug 25

No Splits history available

Zee Entertainment Enterprises Ltd has announced 1:1 bonus issue, ex-date: 11 Nov 10

No Rights history available
Quality key factors
Valuation key factors
Technicals key factors
 Technical Indicator Scale: Bearish, Mildly Bearish, Sideways, Mildly Bullish, Bullish Turned
 Shareholding Snapshot : Jun 2026
Shareholding Compare (%holding)
Non Institution
5.3763
Held by 17 Schemes (3.16%)
Held by 179 FIIs (20.12%)
Essel Media Ventures Limited (3.45%)
Government Pension Fund Global (3.01%)
44.92%
Quarterly Results Snapshot (Consolidated) - Mar'26 - QoQ

QoQ Growth in quarter ended Mar 2026 is -11.20% vs 15.79% in Dec 2025
QoQ Growth in quarter ended Mar 2026 is -166.77% vs 103.01% in Dec 2025
Half Yearly Results Snapshot (Consolidated) - Sep'25
Growth in half year ended Sep 2025 is -8.16% vs -6.57% in Sep 2024
Growth in half year ended Sep 2025 is -32.76% vs 371.22% in Sep 2024
Nine Monthly Results Snapshot (Consolidated) - Dec'25

YoY Growth in nine months ended Dec 2025 is -0.59% vs -5.52% in Dec 2024
YoY Growth in nine months ended Dec 2025 is -23.54% vs 283.67% in Dec 2024
Annual Results Snapshot (Consolidated) - Mar'26
YoY Growth in year ended Mar 2026 is -2.35% vs -3.97% in Mar 2025
YoY Growth in year ended Mar 2026 is -60.07% vs 380.55% in Mar 2025
About Zee Entertainment Enterprises Ltd

Company Coordinates


