
Compare MIRC Electronics with Similar Stocks
Dashboard
With a Operating Losses, the company has a Weak Long Term Fundamental Strength
- Company's ability to service its debt is weak with a poor EBIT to Interest (avg) ratio of -1.08
- The company has been able to generate a Return on Equity (avg) of 0.31% signifying low profitability per unit of shareholders funds
The company has declared Negative results for the last 5 consecutive quarters
Risky - Negative EBITDA
28.42% of Promoter Shares are Pledged
Stock DNA
Electronics & Appliances
INR 1,469 Cr (Micro Cap)
NA (Loss Making)
53
0.00%
0.22
-29.68%
7.82
Total Returns (Price + Dividend) 
Latest dividend: 1 per share ex-dividend date: Jun-09-2011
Risk Adjusted Returns v/s
Returns Beta

News

MIRC Electronics Ltd Locks at Upper Circuit With 20% Gain — Buyers Queue, Sellers Absent
At Rs 39.75, the buying was done — not because demand dried up, but because the exchange wouldn't let the stock go any higher. MIRC Electronics Ltd locked at its upper circuit of 19.98% on 7 May 2026, with buyers queuing and no sellers willing to part with shares.
Read full news article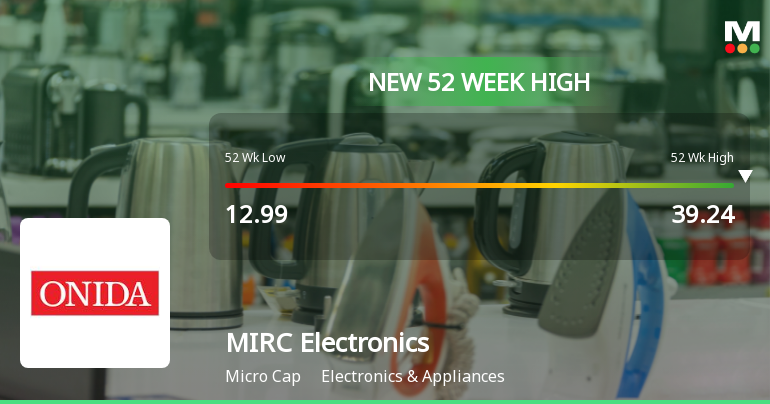
Broad-Based Technical Strength Lifts MIRC Electronics Ltd to 52-Week High of Rs 39.24
Surging past its previous peaks, MIRC Electronics Ltd touched a fresh 52-week high of Rs 39.24 on 7 May 2026, marking a remarkable rally from its 52-week low of Rs 12.99. This milestone reflects a sustained momentum driven by a confluence of bullish technical indicators and robust price action.
Read full news article
MIRC Electronics Ltd is Rated Sell by MarketsMOJO
MIRC Electronics Ltd is rated 'Sell' by MarketsMOJO, with this rating last updated on 21 Apr 2026. However, the analysis and financial metrics discussed here reflect the stock's current position as of 03 May 2026, providing investors with an up-to-date view of the company’s fundamentals, valuation, financial trends, and technical outlook.
Read full news article Announcements
Outcome Of Extra-Ordinary General Meeting Held On Wednesday April 29 2026
30-Apr-2026 | Source : BSEThe Shareholders of the Company passed the following two special resolutions at the Extra-Ordinary General Meeting held on Wednesday April 29 2026: 1. Approval of Grant of Employee Stock Options equal to or exceeding one percent of issued capital of the company to Mr. Gunjan Srivastava CEO of the Company under MIRC Employee Stock Option Plan 2023 2. Approval of change of name of the company and consequent alterations in the Memorandum of Association and Articles of Association of the Company
Shareholder Meeting / Postal Ballot-Scrutinizers Report
30-Apr-2026 | Source : BSEPlease find attached herewith Scrutinizers Report for EGM held on Wednesday April 29 2026.
Shareholder Meeting / Postal Ballot-Outcome of EGM
29-Apr-2026 | Source : BSEProceedings of the EGM held on Wednesday April 29 2026.
Corporate Actions

No Upcoming Board Meetings

MIRC Electronics Ltd has declared 100% dividend, ex-date: 09 Jun 11

No Splits history available

No Bonus history available

MIRC Electronics Ltd has announced 3:14 rights issue, ex-date: 30 Jun 25
Quality key factors
Valuation key factors
Technicals key factors
 Technical Indicator Scale: Bearish, Mildly Bearish, Sideways, Mildly Bullish, Bullish Turned
 Shareholding Snapshot : Mar 2026
Shareholding Compare (%holding)
Non Institution
28.4163
Held by 3 Schemes (0.0%)
Held by 4 FIIs (0.06%)
Glm Family Trust (gulu Lalchand Mirchandani-in The Capacity Of Trustee) (17.65%)
Authum Investment And Infrastructure Limited (21.25%)
27.91%
Quarterly Results Snapshot (Standalone) - Dec'25 - YoY

YoY Growth in quarter ended Dec 2025 is 27.11% vs -43.36% in Dec 2024
YoY Growth in quarter ended Dec 2025 is -148.77% vs -440.00% in Dec 2024
Half Yearly Results Snapshot (Standalone) - Sep'25

Growth in half year ended Sep 2025 is -19.78% vs 0.65% in Sep 2024
Growth in half year ended Sep 2025 is -897.21% vs 114.15% in Sep 2024
Nine Monthly Results Snapshot (Standalone) - Dec'25
YoY Growth in nine months ended Dec 2025 is -5.45% vs -18.66% in Dec 2024
YoY Growth in nine months ended Dec 2025 is -686.78% vs 68.65% in Dec 2024
Annual Results Snapshot (Standalone) - Mar'25
YoY Growth in year ended Mar 2025 is -22.87% vs -12.81% in Mar 2024
YoY Growth in year ended Mar 2025 is 96.30% vs -398.88% in Mar 2024
About MIRC Electronics Ltd

Company Coordinates


