
Compare Simplex Papers with Similar Stocks
Dashboard
With a Negative Book Value, the company has a Weak Long Term Fundamental Strength
- Poor long term growth as Net Sales has grown by an annual rate of % and Operating profit at 0% over the last 5 years
- The company has a negative book value of Rs 12.17 crore
Flat results in Mar 26
Risky - Negative EBITDA
Below par performance in long term as well as near term
Stock DNA
Paper, Forest & Jute Products
INR 4 Cr (Micro Cap)
NA (Loss Making)
23
0.00%
-1.02
1.31%
-0.29
Total Returns (Price + Dividend) 
Simplex Papers for the last several years.
Risk Adjusted Returns v/s
Returns Beta

News
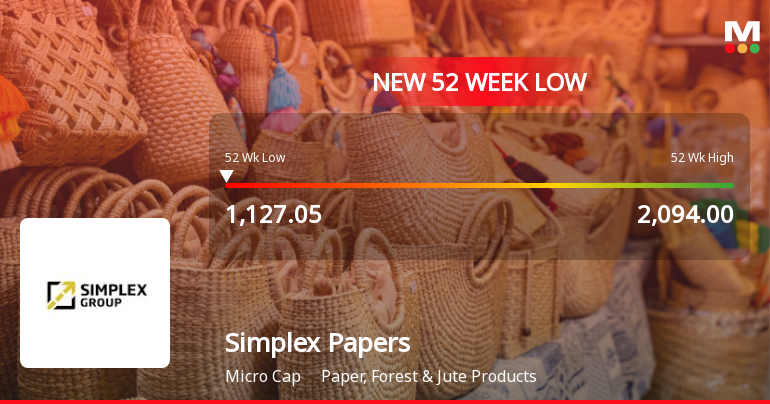
Simplex Papers Ltd Falls to 52-Week Low of Rs 1127 Amid Persistent Downtrend
For the second consecutive session, Simplex Papers Ltd has succumbed to selling pressure, hitting a fresh 52-week low of Rs 1127.05 on 21 Jul 2026. This decline extends the stock’s year-long slide, which now stands at a steep 42.9%, far outpacing the broader Sensex’s modest 5.8% loss over the same period.
Read full news article
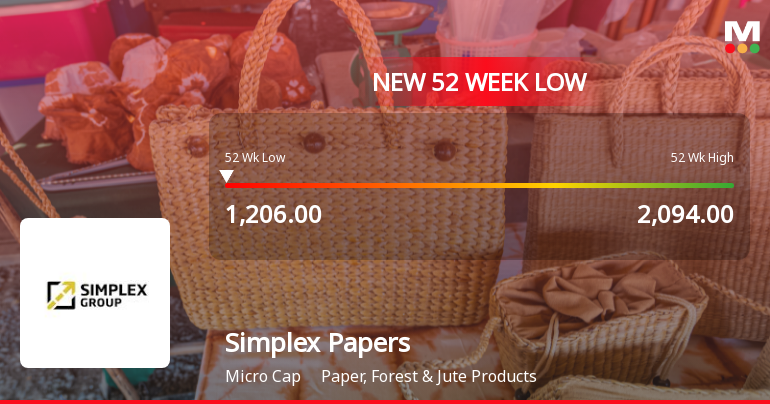
Simplex Papers Ltd Falls to 52-Week Low of Rs 1206 as Sell-Off Deepens
For the third consecutive session, Simplex Papers Ltd has declined, culminating in a fresh 52-week low of Rs 1206 on 12 Jun 2026, marking a significant 36.89% drop over the past year and underperforming the Sensex by nearly 28 percentage points.
Read full news article Announcements
Annual General Meeting Scheduled On 4Th August 2026 At 12.00 Pm
10-Jul-2026 | Source : BSENotice of Annual General meeting of simplex papers ltd which is scheduled on 4th August 2026
Under Reg 36(1) A Letter Providing The Web-Link Including The Exact Path Where Complete Details Of The Annual Report Is Available To Those Shareholder(S) Who Have Not So Registered;
10-Jul-2026 | Source : BSEphysical letter to shareholders providing weblink of annual report
Announcement under Regulation 30 (LODR)-Newspaper Publication
10-Jul-2026 | Source : BSEPost Newspaper publication of Notice of AGM of Simplex Papers Ltd
Corporate Actions

No Upcoming Board Meetings

No Dividend history available

Simplex Papers Ltd has announced 1000:10 stock split, ex-date: 26 May 23

No Bonus history available

No Rights history available
Quality key factors
Valuation key factors
Technicals key factors
 Technical Indicator Scale: Bearish, Mildly Bearish, Sideways, Mildly Bullish, Bullish Turned
 Shareholding Snapshot : Jun 2026
Shareholding Compare (%holding)
Promoters
None
Held by 1 Schemes (0.0%)
Held by 0 FIIs
Simplex Realty Limited (49.01%)
Life Insurance Corporation Of India (12.24%)
34.33%
Quarterly Results Snapshot (Standalone) - Mar'26 - QoQ
QoQ Growth in quarter ended Mar 2026 is 0.00% vs 0.00% in Dec 2025

QoQ Growth in quarter ended Mar 2026 is 33.33% vs 0.00% in Dec 2025
Half Yearly Results Snapshot (Standalone) - Sep'25
Growth in half year ended Sep 2025 is 0.00% vs 0.00% in Sep 2024
Growth in half year ended Sep 2025 is 25.00% vs -140.00% in Sep 2024
Nine Monthly Results Snapshot (Standalone) - Dec'25
YoY Growth in nine months ended Dec 2025 is 0.00% vs 0.00% in Dec 2024
YoY Growth in nine months ended Dec 2025 is 18.18% vs -173.33% in Dec 2024
Annual Results Snapshot (Standalone) - Mar'26
YoY Growth in year ended Mar 2026 is 0.00% vs 0.00% in Mar 2025
YoY Growth in year ended Mar 2026 is 31.25% vs -245.45% in Mar 2025
About Simplex Papers Ltd


