
Compare Bajaj Steel Inds with Similar Stocks
Dashboard
Poor long term growth as Operating profit has grown by an annual rate -12.98% of over the last 5 years
With a fall in Net Sales of -23.93%, the company declared Very Negative results in Mar 26
Despite the size of the company, domestic mutual funds hold only 0% of the company
Underperformed the market in the last 1 year
Stock DNA
Industrial Manufacturing
INR 855 Cr (Micro Cap)
24.00
89
0.23%
-0.12
8.71%
2.11
Total Returns (Price + Dividend) 
Latest dividend: 1 per share ex-dividend date: Aug-26-2025
Risk Adjusted Returns v/s
Returns Beta

News
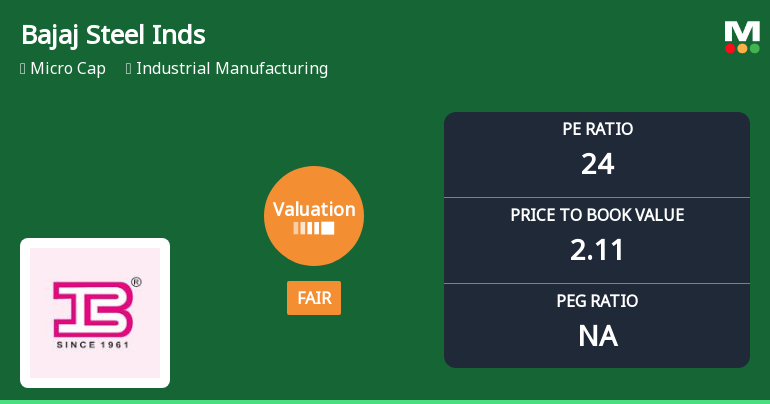
Bajaj Steel Industries Ltd Valuation Shifts: From Attractive to Fair Amid Market Volatility
Bajaj Steel Industries Ltd has witnessed a notable shift in its valuation parameters, moving from an attractive to a fair valuation grade. This change reflects evolving market perceptions amid fluctuating financial metrics and sector dynamics, prompting investors to reassess the stock’s price attractiveness relative to its historical and peer benchmarks.
Read full news article
Bajaj Steel Industries Ltd Upgraded to Sell on Technical and Valuation Improvements
Bajaj Steel Industries Ltd has seen its investment rating upgraded from Strong Sell to Sell, reflecting nuanced shifts across valuation, technical indicators, and financial trends. Despite persistent challenges in profitability and sales, the company’s valuation has become more attractive and technical signals have improved modestly, prompting a reassessment of its market stance.
Read full news article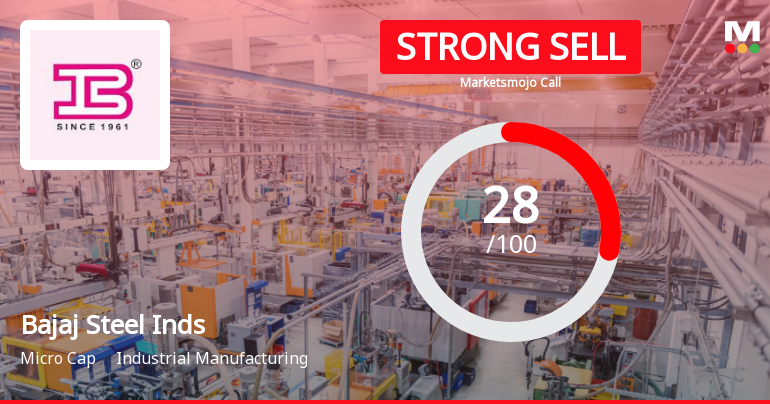
Bajaj Steel Industries Ltd Downgraded to Strong Sell Amid Weak Financials and Mixed Technical Signals
Bajaj Steel Industries Ltd has seen its investment rating downgraded from Sell to Strong Sell, reflecting deteriorating financial performance and mixed technical signals. Despite a recent uptick in share price, the company’s valuation has shifted from attractive to fair, while its long-term growth prospects remain under pressure amid declining sales and profits.
Read full news article Announcements
Compliances-Reg.24(A)-Annual Secretarial Compliance
29-May-2026 | Source : BSEPursuant to Regulation 24(A) of SEBI Listing Regulations 2015 Please find enclosed the Annual Secretarial Compliance Report for the Financial Year 2025-26 issued by M/s Siddharth Sipani & Associates Practicing Company Secretary Nagpur.
Corporate Action-Board approves Dividend
27-May-2026 | Source : BSEPursuant to Regulation 30 of the SEBI Listing Regulations 2015 please find enclosed the outcome of the Board meeting held on May 27 2026 to consider and recommend inter-alia the final dividend for the financial year 2025-26 at Rs. 1/- per equity share subject to further approval of shareholders at the ensuing Annual General Meeting of the Company.
Announcement under Regulation 30 (LODR)-Investor Presentation
27-May-2026 | Source : BSEPursuant to Regulation 30 of SEBI Listing Regulations 2015 please find enclosed the Investor Presentation on the Financial Results of the Company for the quarter and year ended March 31 2026.
Corporate Actions

No Upcoming Board Meetings

Bajaj Steel Industries Ltd has declared 20% dividend, ex-date: 26 Aug 25

Bajaj Steel Industries Ltd has announced 5:10 stock split, ex-date: 24 Mar 20

Bajaj Steel Industries Ltd has announced 3:1 bonus issue, ex-date: 12 Nov 24

No Rights history available
Quality key factors
Valuation key factors
Technicals key factors
 Technical Indicator Scale: Bearish, Mildly Bearish, Sideways, Mildly Bullish, Bullish Turned
 Shareholding Snapshot : Mar 2026
Shareholding Compare (%holding)
Promoters
None
Held by 0 Schemes
Held by 1 FIIs (0.04%)
Vidarbha Tradelinks Private Limited (16.39%)
Bajaj Global Limited (1.88%)
30.89%
Quarterly Results Snapshot (Consolidated) - Mar'26 - YoY

YoY Growth in quarter ended Mar 2026 is -23.93% vs -11.73% in Mar 2025
YoY Growth in quarter ended Mar 2026 is -87.15% vs -19.91% in Mar 2025
Half Yearly Results Snapshot (Consolidated) - Sep'25
Growth in half year ended Sep 2025 is -3.78% vs 16.73% in Sep 2024
Growth in half year ended Sep 2025 is -45.46% vs 98.00% in Sep 2024
Nine Monthly Results Snapshot (Consolidated) - Dec'25
YoY Growth in nine months ended Dec 2025 is -5.53% vs 14.38% in Dec 2024
YoY Growth in nine months ended Dec 2025 is -47.83% vs 81.09% in Dec 2024
Annual Results Snapshot (Consolidated) - Mar'26
YoY Growth in year ended Mar 2026 is -10.36% vs 6.14% in Mar 2025
YoY Growth in year ended Mar 2026 is -56.23% vs 42.88% in Mar 2025
About Bajaj Steel Industries Ltd

Company Coordinates


