
Compare High Energy Bat. with Similar Stocks
Stock DNA
Aerospace & Defense
INR 477 Cr (Micro Cap)
29.00
29
0.57%
0.10
14.62%
4.26
Total Returns (Price + Dividend) 
Latest dividend: 3.0073450200763885 per share ex-dividend date: Jun-12-2026
Risk Adjusted Returns v/s
Returns Beta

News
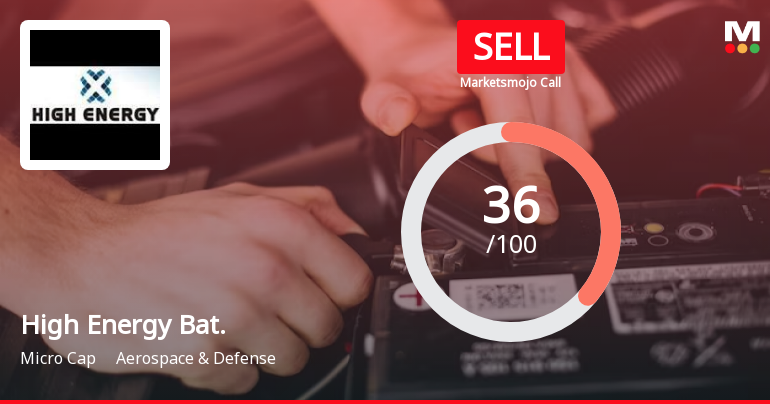
High Energy Batteries (India) Ltd is Rated Sell
High Energy Batteries (India) Ltd is rated 'Sell' by MarketsMOJO. This rating was last updated on 31 January 2026, reflecting a shift from a previous 'Strong Sell' stance. However, all fundamentals, returns, and financial metrics discussed here are current as of 21 June 2026, providing investors with an up-to-date analysis of the stock's position.
Read full news article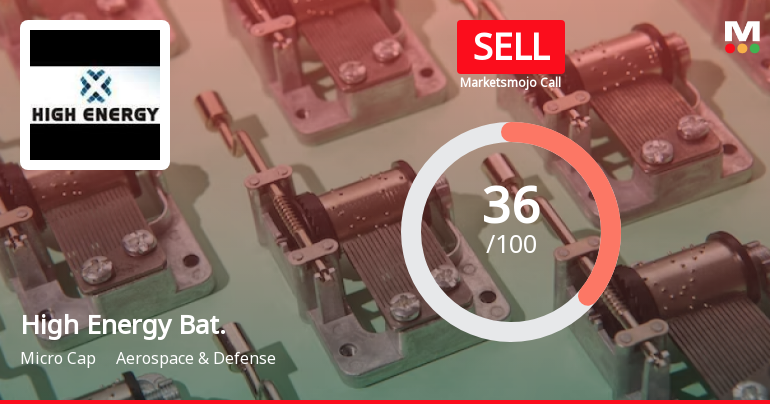
High Energy Batteries (India) Ltd is Rated Sell
High Energy Batteries (India) Ltd is rated 'Sell' by MarketsMOJO, with this rating last updated on 31 January 2026. However, the analysis and financial metrics discussed here reflect the stock's current position as of 10 June 2026, providing investors with an up-to-date perspective on the company’s performance and outlook.
Read full news article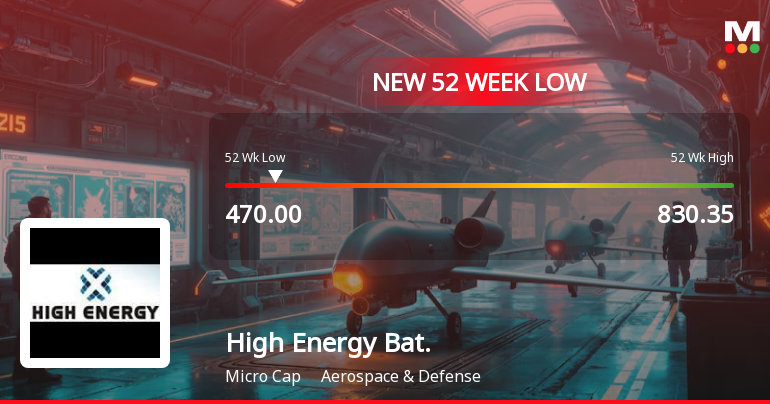
Markets Rally, But High Energy Batteries (India) Ltd Sinks to 52-Week Low in Stock-Specific Sell-Off
While the broader market shows signs of recovery, High Energy Batteries (India) Ltd has succumbed to renewed selling pressure, hitting a fresh 52-week low of Rs 470 on 4 Jun 2026. The stock’s decline contrasts sharply with the Sensex’s modest losses and near-term resilience.
Read full news article Announcements
Intimation Of Third Progress Report Filed With IEPFA On Second 100 Days Campaign
20-Jun-2026 | Source : BSEIntimation of Third Progress Report filed with IEPFA on Second 100 Days Campaign
Announcement under Regulation 30 (LODR)-Newspaper Publication
16-Jun-2026 | Source : BSENewspaper Advertisement - Notice to Shareholders regarding intimation of Second 100 Days Campaign - Saksham Niveshak launched by IEPFA.
Intimation About The Letter Sent To Identified Shareholders For Furnishing Of PAN And KYC Details
10-Jun-2026 | Source : BSEIntimation about the Letter sent to the identified shareholders of the Company for furnishing of PAN and KYC details with the Company / RTA
Corporate Actions

No Upcoming Board Meetings

High Energy Batteries (India) Ltd has declared 150% dividend, ex-date: 12 Jun 26

High Energy Batteries (India) Ltd has announced 2:10 stock split, ex-date: 08 Aug 22

No Bonus history available

High Energy Batteries (India) Ltd has announced 1:1 rights issue, ex-date: 07 May 09
Quality key factors
Valuation key factors
Technicals key factors
 Technical Indicator Scale: Bearish, Mildly Bearish, Sideways, Mildly Bullish, Bullish Turned
 Shareholding Snapshot : Mar 2026
Shareholding Compare (%holding)
Non Institution
None
Held by 0 Schemes
Held by 0 FIIs
Seshasayee Paper And Boards Limited (17.8%)
Minal Bharat Patel (6.38%)
44.51%
Quarterly Results Snapshot (Standalone) - Mar'26 - QoQ

QoQ Growth in quarter ended Mar 2026 is 26.59% vs 34.34% in Dec 2025
QoQ Growth in quarter ended Mar 2026 is 51.80% vs 148.76% in Dec 2025
Half Yearly Results Snapshot (Standalone) - Sep'25

Growth in half year ended Sep 2025 is -5.30% vs -21.21% in Sep 2024
Growth in half year ended Sep 2025 is -40.17% vs -49.19% in Sep 2024
Nine Monthly Results Snapshot (Standalone) - Dec'25
YoY Growth in nine months ended Dec 2025 is 19.69% vs -21.78% in Dec 2024
YoY Growth in nine months ended Dec 2025 is 45.79% vs -57.06% in Dec 2024
Annual Results Snapshot (Standalone) - Mar'26
YoY Growth in year ended Mar 2026 is 2.91% vs 4.56% in Mar 2025
YoY Growth in year ended Mar 2026 is 0.39% vs -10.66% in Mar 2025
About High Energy Batteries (India) Ltd

Company Coordinates


