
Compare Zodiac Vent. with Similar Stocks
Dashboard
Weak Long Term Fundamental Strength with a -14.27% CAGR growth in Operating Profits over the last 5 years
- Low ability to service debt as the company has a high Debt to EBITDA ratio of 8.10 times
Flat results in Mar 26
With ROCE of 3.6, it has a Very Expensive valuation with a 0.5 Enterprise value to Capital Employed
Consistent Underperformance against the benchmark over the last 3 years
Stock DNA
Commercial Services & Supplies
INR 14 Cr (Micro Cap)
9.00
35
5.85%
0.43
3.53%
0.32
Total Returns (Price + Dividend) 
Latest dividend: 0.1 per share ex-dividend date: Sep-23-2025
Risk Adjusted Returns v/s
Returns Beta

News
Are Zodiac Ventures Ltd latest results good or bad?
Zodiac Ventures Ltd's latest financial results for Q4 FY26 reveal a complex operational landscape. The company reported a consolidated net profit of ₹0.63 crores, reflecting a notable increase compared to the previous quarter. However, this profit surge primarily stemmed from a significant reliance on other income, which constituted 64.4% of total operating profit, raising concerns about the sustainability and quality of earnings. In terms of revenue, net sales experienced a quarter-on-quarter decline of 26.83%, dropping to ₹0.90 crores from ₹1.23 crores in the prior quarter. This decline contrasts sharply with a year-on-year increase of 200.00%, indicating volatility in revenue generation, particularly influenced by the cyclical nature of real estate projects. The operating margin, excluding other income, fell to 38.89%, marking the lowest level in seven quarters, which suggests increasing pressure on the...
Read full news article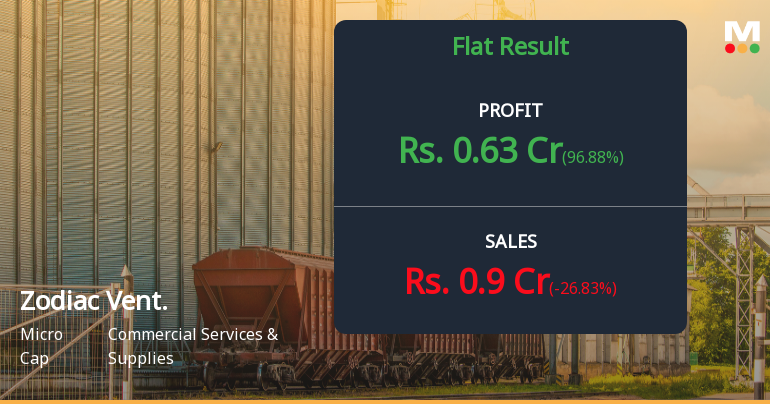
Zodiac Ventures Q4 FY26: Profit Surge Masks Operational Deterioration
Zodiac Ventures Ltd., a Mumbai-based real estate development company with a market capitalisation of ₹15.00 crores, reported a consolidated net profit of ₹0.63 crores for Q4 FY26 (Mar'26), marking a dramatic 96.88% quarter-on-quarter surge and a 133.33% year-on-year increase. However, beneath the headline profit growth lies a troubling operational picture characterised by sharply declining revenues, collapsing margins, and deteriorating core business performance that raises serious questions about the sustainability of this micro-cap company's earnings trajectory.
Read full news article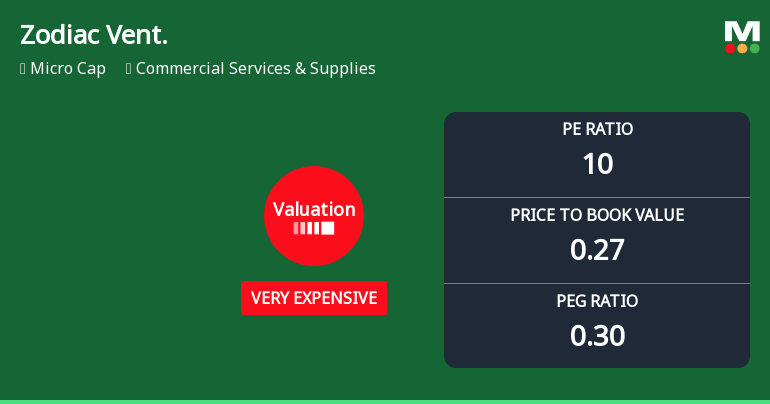
Zodiac Ventures Ltd Valuation Shifts to Very Expensive Amid Steep Price Declines
Zodiac Ventures Ltd, a micro-cap player in the Commercial Services & Supplies sector, has seen a marked shift in its valuation parameters, moving from an expensive to a very expensive rating. Despite a modest day gain of 4.44%, the company’s price-to-earnings (P/E) and price-to-book value (P/BV) ratios reveal a complex picture of price attractiveness, especially when compared with peers and historical benchmarks.
Read full news article Announcements
Submission Of Reg 32- Statement Of Deviation And Variation.
30-May-2026 | Source : BSESubmission of Reg 32- Statement of Deviation and Variation.
Compliances-Reg.24(A)-Annual Secretarial Compliance
29-May-2026 | Source : BSESubmission of Annual Secretarial Compliance Report for the FY ended 31st March 2026.
Announcement under Regulation 30 (LODR)-Resignation of Company Secretary / Compliance Officer
22-May-2026 | Source : BSEIntimation of resignation of Company Secretary and Compliance Officer.
Corporate Actions

No Upcoming Board Meetings

Zodiac Ventures Ltd has declared 10% dividend, ex-date: 23 Sep 25

Zodiac Ventures Ltd has announced 1:10 stock split, ex-date: 21 Aug 14

No Bonus history available

Zodiac Ventures Ltd has announced 6:5 rights issue, ex-date: 18 Jul 25
Quality key factors
Valuation key factors
Technicals key factors
 Technical Indicator Scale: Bearish, Mildly Bearish, Sideways, Mildly Bullish, Bullish Turned
 Shareholding Snapshot : Mar 2026
Shareholding Compare (%holding)
Non Institution
None
Held by 0 Schemes
Held by 0 FIIs
Ramesh Virji Shah (15.23%)
Niraj Rajnikant Shah (3.63%)
61.99%
Quarterly Results Snapshot (Consolidated) - Mar'26 - QoQ

QoQ Growth in quarter ended Mar 2026 is -26.83% vs 86.36% in Dec 2025

QoQ Growth in quarter ended Mar 2026 is 96.88% vs 10.34% in Dec 2025
Half Yearly Results Snapshot (Consolidated) - Sep'25
Growth in half year ended Sep 2025 is 120.34% vs 0.00% in Sep 2024
Growth in half year ended Sep 2025 is 63.89% vs -36.84% in Sep 2024
Nine Monthly Results Snapshot (Consolidated) - Dec'25
YoY Growth in nine months ended Dec 2025 is 94.62% vs 113.11% in Dec 2024
YoY Growth in nine months ended Dec 2025 is 56.90% vs -6.45% in Dec 2024
Annual Results Snapshot (Consolidated) - Mar'26
YoY Growth in year ended Mar 2026 is 114.38% vs 171.19% in Mar 2025
YoY Growth in year ended Mar 2026 is 52.48% vs 98.04% in Mar 2025
About Zodiac Ventures Ltd

Company Coordinates


