
Compare National Plastic with Similar Stocks
Stock DNA
Plastic Products - Industrial
INR 124 Cr (Micro Cap)
14.00
36
0.74%
1.03
16.88%
2.22
Total Returns (Price + Dividend) 
Latest dividend: 1.5 per share ex-dividend date: Sep-04-2025
Risk Adjusted Returns v/s
Returns Beta

News
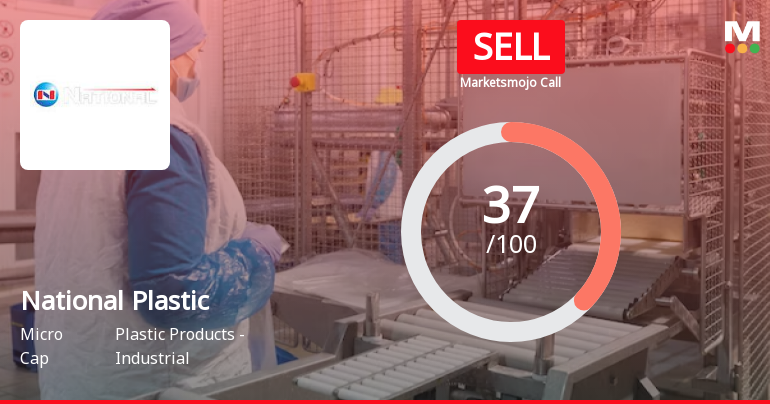
National Plastic Technologies Ltd is Rated Sell
National Plastic Technologies Ltd is rated Sell by MarketsMOJO, with this rating last updated on 16 February 2026. However, the analysis and financial metrics discussed here reflect the company’s current position as of 27 June 2026, providing investors with an up-to-date view of the stock’s fundamentals, valuation, financial trends, and technical outlook.
Read full news article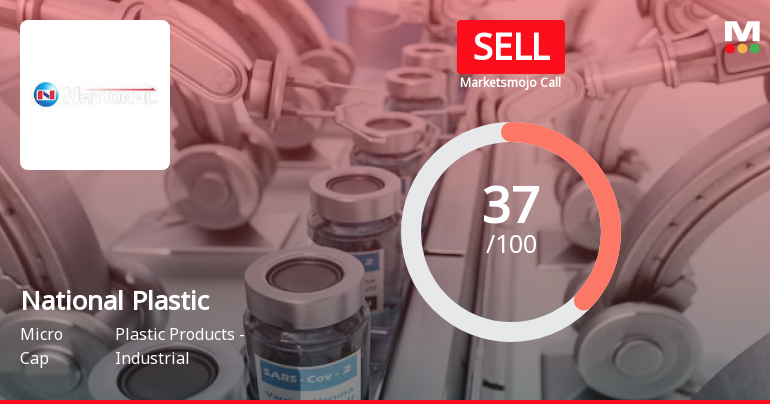
National Plastic Technologies Ltd is Rated Sell
National Plastic Technologies Ltd is rated 'Sell' by MarketsMOJO, with this rating last updated on 16 February 2026. However, the analysis and financial metrics discussed here reflect the company’s current position as of 16 June 2026, providing investors with an up-to-date view of its fundamentals, returns, and market standing.
Read full news article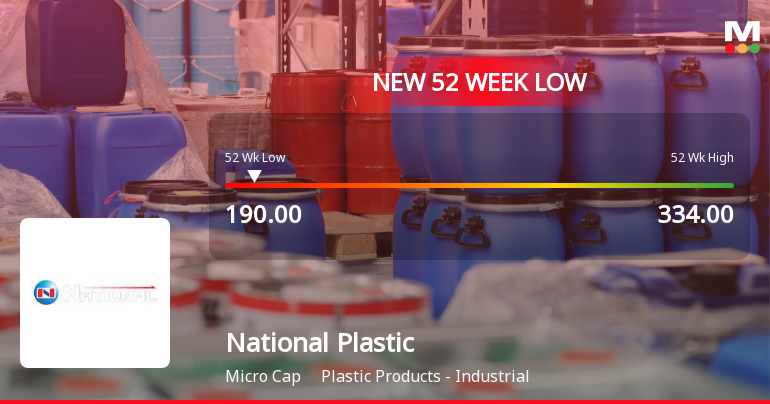
Five Consecutive Losses Push National Plastic Technologies Ltd to a New 52-Week Low
For the fifth straight session, National Plastic Technologies Ltd closed lower, breaching its 52-week low at Rs 190 on 8 Jun 2026, marking a significant decline from its 52-week high of Rs 334. This persistent downtrend reflects mounting pressure amid a challenging market backdrop and company-specific financial headwinds.
Read full news article Announcements
Announcement under Regulation 30 (LODR)-Newspaper Publication
27-May-2026 | Source : BSENewspaper Advertisement
Compliances-Reg.24(A)-Annual Secretarial Compliance
26-May-2026 | Source : BSEAnnual Secretarial Compliance Report
Announcement under Regulation 30 (LODR)-Change in Management
25-May-2026 | Source : BSEAppointment of Internal Auditor
Corporate Actions

No Upcoming Board Meetings

National Plastic Technologies Ltd has declared 15% dividend, ex-date: 04 Sep 25

No Splits history available

No Bonus history available

No Rights history available
Quality key factors
Valuation key factors
Technicals key factors
 Technical Indicator Scale: Bearish, Mildly Bearish, Sideways, Mildly Bullish, Bullish Turned
 Shareholding Snapshot : Mar 2026
Shareholding Compare (%holding)
Promoters
None
Held by 0 Schemes
Held by 0 FIIs
Sudershan Parakh (24.98%)
Deepinder Singh Poonian (3.27%)
27.15%
Quarterly Results Snapshot (Standalone) - Mar'26 - YoY

YoY Growth in quarter ended Mar 2026 is 17.68% vs 10.01% in Mar 2025

YoY Growth in quarter ended Mar 2026 is -30.05% vs -2.29% in Mar 2025
Half Yearly Results Snapshot (Standalone) - Sep'25
Growth in half year ended Sep 2025 is 4.81% vs 15.19% in Sep 2024
Growth in half year ended Sep 2025 is 6.71% vs 8.71% in Sep 2024
Nine Monthly Results Snapshot (Standalone) - Dec'25
YoY Growth in nine months ended Dec 2025 is 7.29% vs 17.25% in Dec 2024
YoY Growth in nine months ended Dec 2025 is 11.45% vs 10.58% in Dec 2024
Annual Results Snapshot (Standalone) - Mar'26
YoY Growth in year ended Mar 2026 is 9.84% vs 15.39% in Mar 2025
YoY Growth in year ended Mar 2026 is 1.55% vs 7.24% in Mar 2025
About National Plastic Technologies Ltd

Company Coordinates


