
Compare Sikozy Realtors with Similar Stocks
Dashboard
With a Negative Book Value, the company has a Weak Long Term Fundamental Strength
- Poor long term growth as Net Sales has grown by an annual rate of 14.00% and Operating profit at 0% over the last 5 years
- The company has a negative book value of Rs 0.05 crore
Flat results in Mar 26
Risky - Negative EBITDA
Total Returns (Price + Dividend) 
Sikozy Realtors for the last several years.
Risk Adjusted Returns v/s
Returns Beta

News

Broad-Based Technical Strength Lifts Sikozy Realtors Ltd to 52-Week High of Rs 1.99
Surging past its previous peaks, Sikozy Realtors Ltd touched a fresh 52-week high of Rs 1.99 on 24 Jun 2026, marking a remarkable rally of 109.47% over the past year. This milestone comes amid a sustained six-day winning streak, reflecting robust price momentum and a confluence of bullish technical indicators.
Read full news article
Broad-Based Technical Strength Lifts Sikozy Realtors Ltd to 52-Week High of Rs 1.9
With a sustained rally pushing Sikozy Realtors Ltd to a fresh 52-week high of Rs 1.9 on 23 Jun 2026, the stock has demonstrated remarkable momentum, outperforming its sector and the broader market over the past year.
Read full news article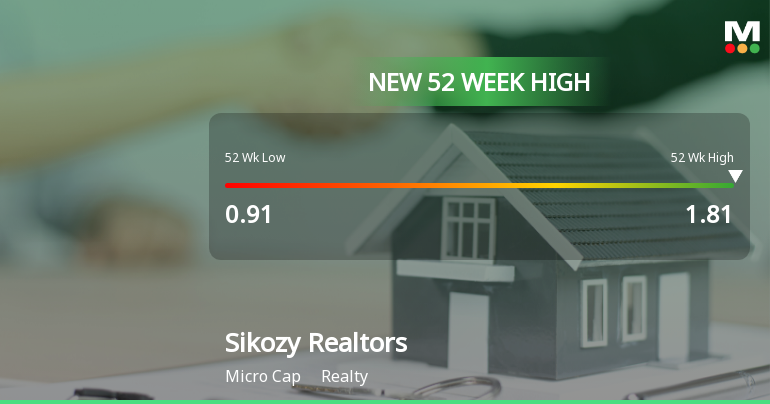
Broad-Based Technical Strength Lifts Sikozy Realtors Ltd to 52-Week High of Rs 1.81
Surging to a fresh 52-week high of Rs 1.81 on 22 Jun 2026, Sikozy Realtors Ltd has demonstrated remarkable price momentum, outpacing its sector and the broader market with a 19.87% gain over the past four trading sessions. This rally has been underpinned by a confluence of bullish technical indicators and sustained buying interest, signalling robust momentum in the stock’s price action.
Read full news article Announcements
Announcement under Regulation 30 (LODR)-Resignation of Director
15-Jul-2026 | Source : BSEPlease find the attached Reply.
Compliances-Certificate under Reg. 74 (5) of SEBI (DP) Regulations 2018
14-Jul-2026 | Source : BSEPlease find the attached submission.
Announcement under Regulation 30 (LODR)-Restructuring
08-Jul-2026 | Source : BSEPlease find the attached submission.
Corporate Actions

No Upcoming Board Meetings

No Dividend history available

Sikozy Realtors Ltd has announced 1:10 stock split, ex-date: 01 Nov 12

No Bonus history available

No Rights history available
Quality key factors
Valuation key factors
Technicals key factors
 Technical Indicator Scale: Bearish, Mildly Bearish, Sideways, Mildly Bullish, Bullish Turned
 Shareholding Snapshot : Jun 2026
Shareholding Compare (%holding)
Non Institution
None
Held by 0 Schemes
Held by 0 FIIs
Kamlesh Kantilal Desai (0.27%)
Rishit Dinesh Maniar (11.84%)
93.57%
Quarterly Results Snapshot (Standalone) - Mar'26 - YoY
YoY Growth in quarter ended Mar 2026 is 0.00% vs 0.00% in Mar 2025

YoY Growth in quarter ended Mar 2026 is -150.00% vs -50.00% in Mar 2025
Half Yearly Results Snapshot (Standalone) - Sep'25
Growth in half year ended Sep 2025 is 0.00% vs 0.00% in Sep 2024
Growth in half year ended Sep 2025 is -150.00% vs 33.33% in Sep 2024
Nine Monthly Results Snapshot (Standalone) - Dec'25
YoY Growth in nine months ended Dec 2025 is 0.00% vs 0.00% in Dec 2024
YoY Growth in nine months ended Dec 2025 is -90.91% vs -10.00% in Dec 2024
Annual Results Snapshot (Standalone) - Mar'26
YoY Growth in year ended Mar 2026 is 0.00% vs 0.00% in Mar 2025
YoY Growth in year ended Mar 2026 is -111.76% vs -21.43% in Mar 2025
About Sikozy Realtors Ltd

Company Coordinates


