
Compare Devine Impex with Similar Stocks
Dashboard
With a Operating Losses, the company has a Weak Long Term Fundamental Strength
- Company's ability to service its debt is weak with a poor EBIT to Interest (avg) ratio of 0.05
- The company has been able to generate a Return on Equity (avg) of 0.25% signifying low profitability per unit of shareholders funds
Flat results in Mar 26
With ROE of 0.2, it has a Very Expensive valuation with a 0.6 Price to Book Value
Stock DNA
Trading & Distributors
INR 8 Cr (Micro Cap)
264.00
50
0.00%
0.00
0.22%
0.58
Total Returns (Price + Dividend) 
Devine Impex for the last several years.
Risk Adjusted Returns v/s
Returns Beta

News
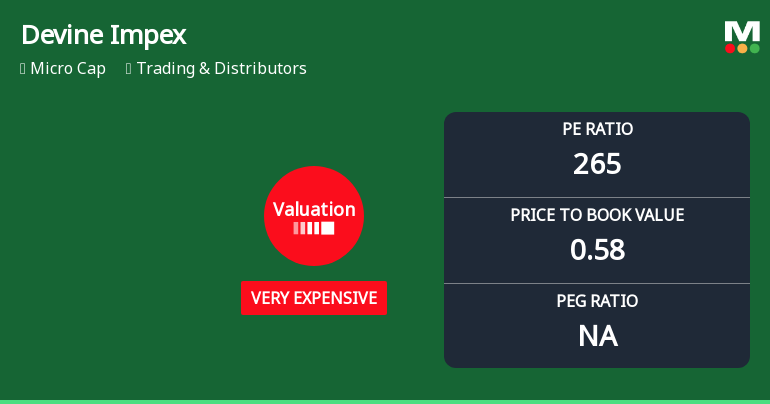
Devine Impex Ltd Valuation Shifts Signal Heightened Price Risk Amid Micro-Cap Status
Devine Impex Ltd, a micro-cap player in the Trading & Distributors sector, has seen a marked shift in its valuation parameters, moving from an already expensive rating to a very expensive classification. This change, coupled with its elevated price-to-earnings (P/E) ratio of 265.31 and a price-to-book value (P/BV) of 0.58, raises questions about the stock’s price attractiveness relative to its historical averages and peer group. Despite a recent uptick in share price, the company’s fundamental metrics and market positioning suggest caution for investors.
Read full news article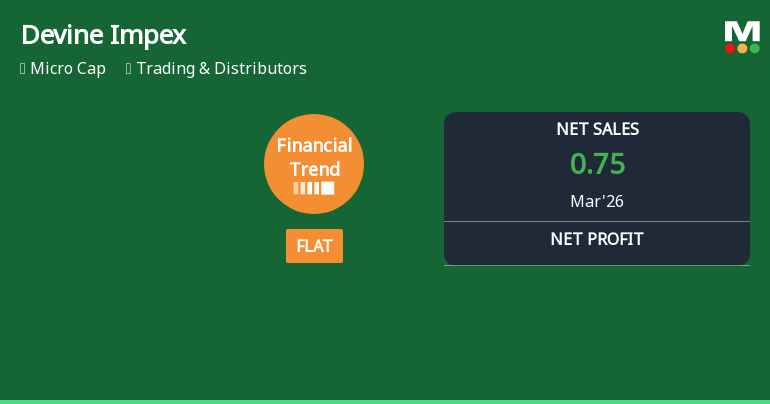
Devine Impex Ltd Reports Flat Quarterly Performance Amid Margin Pressures
Devine Impex Ltd, a micro-cap player in the Trading & Distributors sector, has reported a flat financial performance for the quarter ended March 2026, signalling a notable shift from its previously positive growth trajectory. The company’s financial trend score has declined sharply from 7 to -2 over the past three months, reflecting mounting pressures on profitability and operational efficiency despite a marginal increase in profit after tax for the nine-month period.
Read full news article Announcements
Closure of Trading Window
30-Jun-2026 | Source : BSESubmission of intimation of closure of trading window
Announcement under Regulation 30 (LODR)-Newspaper Publication
29-May-2026 | Source : BSESubmission of Newspaper Advertisement
Audited Financial Results For The Quarter And Year Ended 31.03.2026
27-May-2026 | Source : BSESubmission of Audited Financial Results for the quarter and year ended 31.03.2026
Corporate Actions

No Upcoming Board Meetings

No Dividend history available

No Splits history available

No Bonus history available

No Rights history available
Quality key factors
Valuation key factors
Technicals key factors
 Technical Indicator Scale: Bearish, Mildly Bearish, Sideways, Mildly Bullish, Bullish Turned
 Shareholding Snapshot : Mar 2026
Shareholding Compare (%holding)
Non Institution
None
Held by 1 Schemes (0.02%)
Held by 0 FIIs
Manju Jain (13.11%)
Synergy Cosmetics (exim) Limited (7.76%)
17.73%
Quarterly Results Snapshot (Standalone) - Mar'26 - QoQ

QoQ Growth in quarter ended Mar 2026 is 63.04% vs 24.32% in Dec 2025

QoQ Growth in quarter ended Mar 2026 is -190.00% vs 233.33% in Dec 2025
Half Yearly Results Snapshot (Standalone) - Sep'25
Growth in half year ended Sep 2025 is -31.51% vs 52.08% in Sep 2024
Growth in half year ended Sep 2025 is 0.00% vs 166.67% in Sep 2024
Nine Monthly Results Snapshot (Standalone) - Dec'25
YoY Growth in nine months ended Dec 2025 is -10.28% vs 48.61% in Dec 2024
YoY Growth in nine months ended Dec 2025 is 200.00% vs 100.00% in Dec 2024
Annual Results Snapshot (Standalone) - Mar'26
YoY Growth in year ended Mar 2026 is -15.00% vs 13.64% in Mar 2025
YoY Growth in year ended Mar 2026 is 0.00% vs -25.00% in Mar 2025
About Devine Impex Ltd

Company Coordinates


