
Compare KIFS Financial with Similar Stocks
Stock DNA
Non Banking Financial Company (NBFC)
INR 129 Cr (Micro Cap)
16.00
21
1.25%
6.02
12.59%
2.05
Total Returns (Price + Dividend) 
Latest dividend: 1.5 per share ex-dividend date: Aug-12-2025
Risk Adjusted Returns v/s
Returns Beta

News
KIFS Financial Services Ltd is Rated Sell
KIFS Financial Services Ltd is rated 'Sell' by MarketsMOJO, with this rating last updated on 12 May 2026. However, the analysis and financial metrics discussed here reflect the stock's current position as of 27 June 2026, providing investors with the latest insights into its performance and outlook.
Read full news article
KIFS Financial Services Ltd is Rated Sell
KIFS Financial Services Ltd is rated 'Sell' by MarketsMOJO, with this rating last updated on 12 May 2026. However, the analysis and financial metrics presented here reflect the stock's current position as of 16 June 2026, providing investors with the latest insights into its performance and outlook.
Read full news article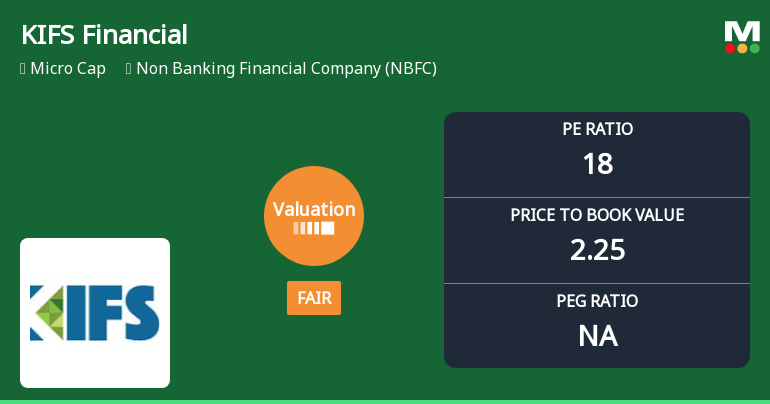
KIFS Financial Services Ltd: Valuation Shifts Signal Changing Market Sentiment
KIFS Financial Services Ltd, a micro-cap player in the Non Banking Financial Company (NBFC) sector, has witnessed a notable shift in its valuation parameters, moving from a previously very attractive rating to a fair valuation grade. This change comes amid a backdrop of mixed market returns and evolving sector dynamics, prompting investors to reassess the stock’s price attractiveness relative to its historical and peer benchmarks.
Read full news article Announcements
Closure of Trading Window
25-Jun-2026 | Source : BSEClosure of Trading Window
Announcement under Regulation 30 (LODR)-Newspaper Publication
10-Jun-2026 | Source : BSENewspaper Publication regarding opening of special window for re-lodgement of transfer requests of physical shares
Compliances-Reg.24(A)-Annual Secretarial Compliance
29-May-2026 | Source : BSEAnnual Secretarial Compliance report pursuant to Regulation 24(A) of the SEBI (Listing Obligations and Disclosure Requirements) Regulations 2015 for the financial year ended on March 31 2026
Corporate Actions

No Upcoming Board Meetings

KIFS Financial Services Ltd has declared 15% dividend, ex-date: 12 Aug 25

No Splits history available

No Bonus history available

No Rights history available
Quality key factors
Valuation key factors
Technicals key factors
 Technical Indicator Scale: Bearish, Mildly Bearish, Sideways, Mildly Bullish, Bullish Turned
 Shareholding Snapshot : Mar 2026
Shareholding Compare (%holding)
Promoters
None
Held by 0 Schemes
Held by 0 FIIs
Khandwala Commercial Private Limited (74.41%)
Affluence Shares And Stocks Private Limited (4.63%)
18.61%
Quarterly Results Snapshot (Standalone) - Mar'26 - QoQ

QoQ Growth in quarter ended Mar 2026 is 67.55% vs 1.42% in Dec 2025

QoQ Growth in quarter ended Mar 2026 is -19.05% vs 8.96% in Dec 2025
Half Yearly Results Snapshot (Standalone) - Sep'25
Growth in half year ended Sep 2025 is -1.52% vs 6.87% in Sep 2024
Growth in half year ended Sep 2025 is 20.95% vs 0.32% in Sep 2024
Nine Monthly Results Snapshot (Standalone) - Dec'25
YoY Growth in nine months ended Dec 2025 is 6.62% vs -24.05% in Dec 2024
YoY Growth in nine months ended Dec 2025 is 24.39% vs 6.96% in Dec 2024
Annual Results Snapshot (Standalone) - Mar'26
YoY Growth in year ended Mar 2026 is 23.59% vs -37.56% in Mar 2025
YoY Growth in year ended Mar 2026 is -0.99% vs 13.34% in Mar 2025
About KIFS Financial Services Ltd

Company Coordinates


