
Compare Garnet Intl. with Similar Stocks
Stock DNA
Non Banking Financial Company (NBFC)
INR 118 Cr (Micro Cap)
26.00
22
0.00%
0.02
11.18%
2.91
Total Returns (Price + Dividend) 
Latest dividend: 0.5 per share ex-dividend date: Aug-31-2018
Risk Adjusted Returns v/s
Returns Beta

News

Garnet International Ltd Upgraded to Sell on Improved Valuation Metrics
Garnet International Ltd, a micro-cap player in the Non Banking Financial Company (NBFC) sector, has seen its investment rating upgraded from Strong Sell to Sell as of 2 July 2026. This change is primarily driven by a marked improvement in valuation metrics, even as the company continues to grapple with weak financial trends and quality concerns. The stock’s recent performance and technical indicators also contributed to the nuanced reassessment by MarketsMOJO.
Read full news article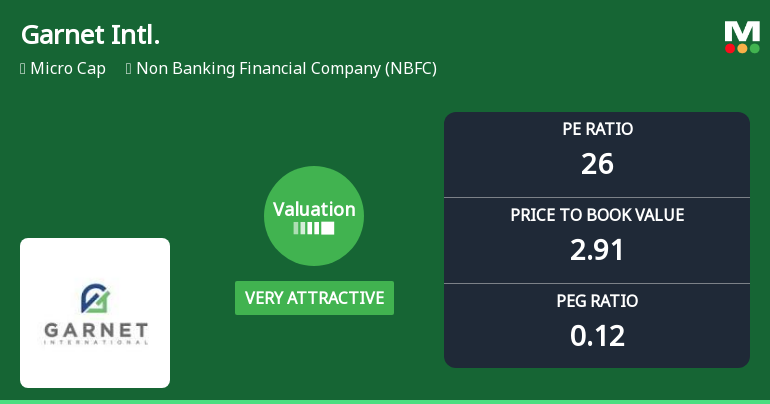
Garnet International Ltd Valuation Shifts to Very Attractive Amid Market Volatility
Garnet International Ltd, a micro-cap player in the Non Banking Financial Company (NBFC) sector, has seen a notable shift in its valuation parameters, moving from a fair to a very attractive rating. Despite a recent decline in share price, the company’s price-to-earnings (P/E) and price-to-book value (P/BV) ratios suggest a compelling entry point relative to its historical averages and peer group, signalling potential value for discerning investors.
Read full news article
Garnet International Ltd is Rated Strong Sell
Garnet International Ltd is rated Strong Sell by MarketsMOJO, with this rating last updated on 09 June 2026. However, the analysis and financial metrics presented here reflect the stock’s current position as of 25 June 2026, providing investors with the most recent and relevant data to assess the company’s outlook.
Read full news article Announcements
Announcement under Regulation 30 (LODR)-Change in Management
30-Jun-2026 | Source : BSEResignation of Company Secretary
Board Meeting Outcome for Outcome Of Board Meeting
30-Jun-2026 | Source : BSEOutcome of Board Meeting
Announcement under Regulation 30 (LODR)-Change in Management
25-Jun-2026 | Source : BSEChange in Management - Resignation of Company Secretary
Corporate Actions

No Upcoming Board Meetings

Garnet International Ltd has declared 5% dividend, ex-date: 31 Aug 18

No Splits history available

Garnet International Ltd has announced 2:1 bonus issue, ex-date: 06 Mar 18

No Rights history available
Quality key factors
Valuation key factors
Technicals key factors
 Technical Indicator Scale: Bearish, Mildly Bearish, Sideways, Mildly Bullish, Bullish Turned
 Shareholding Snapshot : Mar 2026
Shareholding Compare (%holding)
Non Institution
49.7294
Held by 0 Schemes
Held by 0 FIIs
Ramakant Gaggar (21.12%)
Akalka Kakkar . (5.13%)
26.75%
Quarterly Results Snapshot (Consolidated) - Mar'26 - QoQ

QoQ Growth in quarter ended Mar 2026 is 50.00% vs -86.27% in Dec 2025
QoQ Growth in quarter ended Mar 2026 is 390.91% vs -96.09% in Dec 2025
Half Yearly Results Snapshot (Consolidated) - Sep'25
Growth in half year ended Sep 2025 is 1.71% vs -80.80% in Sep 2024
Growth in half year ended Sep 2025 is 208.27% vs 150.96% in Sep 2024
Nine Monthly Results Snapshot (Consolidated) - Dec'25
YoY Growth in nine months ended Dec 2025 is -36.06% vs -79.29% in Dec 2024
YoY Growth in nine months ended Dec 2025 is 269.30% vs 254.05% in Dec 2024
Annual Results Snapshot (Consolidated) - Mar'26
YoY Growth in year ended Mar 2026 is -44.22% vs -57.06% in Mar 2025
YoY Growth in year ended Mar 2026 is 212.50% vs 125.38% in Mar 2025
About Garnet International Ltd

Company Coordinates


