
Compare TTK Healthcare with Similar Stocks
Dashboard
Poor long term growth as Net Sales has grown by an annual rate of 7.60% and Operating profit at 1.48% over the last 5 years
Flat results in Mar 26
Despite the size of the company, domestic mutual funds hold only 0.01% of the company
Consistent Underperformance against the benchmark over the last 3 years
Total Returns (Price + Dividend) 
Latest dividend: 10 per share ex-dividend date: Jul-18-2025
Risk Adjusted Returns v/s
Returns Beta

News

TTK Healthcare Ltd. is Rated Sell by MarketsMOJO
TTK Healthcare Ltd. is rated 'Sell' by MarketsMOJO, with this rating last updated on 21 Jul 2025. However, the analysis and financial metrics discussed here reflect the stock's current position as of 09 July 2026, providing investors with an up-to-date view of the company’s performance and outlook.
Read full news article
TTK Healthcare Ltd. is Rated Sell
TTK Healthcare Ltd. is rated 'Sell' by MarketsMOJO, with this rating last updated on 21 July 2025. However, the analysis and financial metrics discussed here reflect the stock's current position as of 28 June 2026, providing investors with an up-to-date view of the company’s fundamentals, returns, and market performance.
Read full news article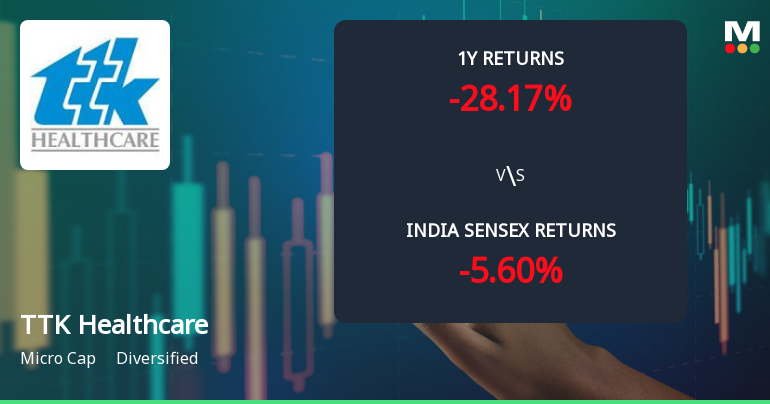
TTK Healthcare Ltd. Technical Momentum Shifts Amid Mixed Market Signals
TTK Healthcare Ltd., a micro-cap player in the diversified sector, has experienced a notable shift in price momentum and technical indicators, reflecting a complex market stance. Despite a recent 5.56% surge in daily price, the company’s technical parameters reveal a blend of mildly bullish and bearish signals, prompting a downgrade in its Mojo Grade from Hold to Sell as of 21 Jul 2025.
Read full news article Announcements
Compliances-Certificate under Reg. 74 (5) of SEBI (DP) Regulations 2018
03-Jul-2026 | Source : BSECertificate under Reg 74(5) of SEBI (DP) Regulations 2018
Annual Report 2025-26
27-Jun-2026 | Source : BSEAnnual Report 2025-26
Reg. 34 (1) Annual Report.
27-Jun-2026 | Source : BSEAnnual Report for Financial Year 2025-26
Corporate Actions

No Upcoming Board Meetings

TTK Healthcare Ltd. has declared 100% dividend, ex-date: 17 Jul 26

No Splits history available

No Bonus history available

No Rights history available
Quality key factors
Valuation key factors
Technicals key factors
 Technical Indicator Scale: Bearish, Mildly Bearish, Sideways, Mildly Bullish, Bullish Turned
 Shareholding Snapshot : Mar 2026
Shareholding Compare (%holding)
Promoters
None
Held by 3 Schemes (0.0%)
Held by 9 FIIs (1.9%)
T T Krishnamachari & Co. Represented By Its Partners - Mr T T Jagannathan And Mr T T Raghunathan (67.46%)
Jupiter India Fund (1.52%)
15.66%
Quarterly Results Snapshot (Standalone) - Mar'26 - YoY

YoY Growth in quarter ended Mar 2026 is 14.51% vs 5.14% in Mar 2025
YoY Growth in quarter ended Mar 2026 is 34.74% vs -11.60% in Mar 2025
Half Yearly Results Snapshot (Standalone) - Sep'25
Growth in half year ended Sep 2025 is 5.81% vs 4.77% in Sep 2024

Growth in half year ended Sep 2025 is -31.55% vs 53.98% in Sep 2024
Nine Monthly Results Snapshot (Standalone) - Dec'25
YoY Growth in nine months ended Dec 2025 is 4.61% vs 6.89% in Dec 2024
YoY Growth in nine months ended Dec 2025 is -32.96% vs 46.98% in Dec 2024
Annual Results Snapshot (Standalone) - Mar'26
YoY Growth in year ended Mar 2026 is 6.96% vs 6.47% in Mar 2025
YoY Growth in year ended Mar 2026 is -19.57% vs 29.95% in Mar 2025
About TTK Healthcare Ltd.

Company Coordinates


