
Compare HB Estate Devel. with Similar Stocks
Total Returns (Price + Dividend) 
Latest dividend: 0.5 per share ex-dividend date: Nov-13-2013
Risk Adjusted Returns v/s
Returns Beta

News

HB Estate Developers Ltd is Rated Sell
HB Estate Developers Ltd is rated 'Sell' by MarketsMOJO, with this rating last updated on 8 May 2026. However, the analysis and financial metrics discussed here reflect the stock's current position as of 14 June 2026, providing investors with the most recent insights into the company's performance and outlook.
Read full news article
HB Estate Developers Ltd is Rated Sell
HB Estate Developers Ltd is rated 'Sell' by MarketsMOJO. This rating was last updated on 08 May 2026, reflecting a reassessment of the stock’s outlook. However, all fundamentals, returns, and financial metrics discussed here are current as of 02 June 2026, providing investors with the latest perspective on the company’s position.
Read full news article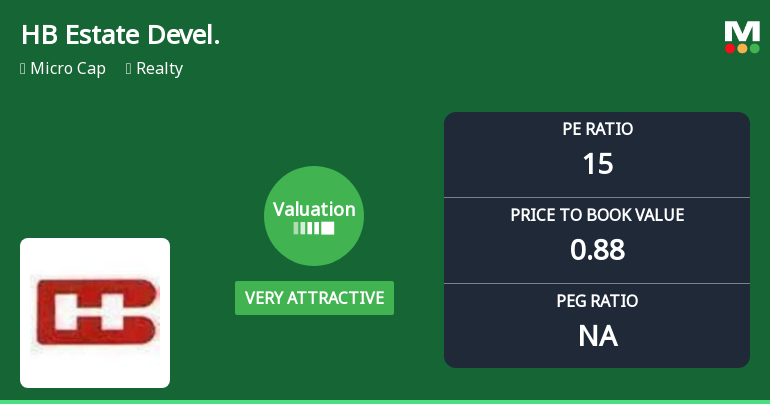
HB Estate Developers Ltd Valuation Shifts Signal Renewed Price Attractiveness
HB Estate Developers Ltd has seen a marked improvement in its valuation parameters, shifting from an attractive to a very attractive rating, despite a recent downgrade in its overall Mojo Grade to Sell. This article analyses the key valuation metrics, compares them with industry peers, and assesses the implications for investors amid a mixed performance backdrop.
Read full news article Announcements
Disclosures under Reg. 29(2) of SEBI (SAST) Regulations 2011
12-Jun-2026 | Source : BSEThe Exchange has received the disclosure under Regulation 29(2) of SEBI (Substantial Acquisition of Shares & Takeovers) Regulations 2011 for Rima Arora
Disclosures under Reg. 29(2) of SEBI (SAST) Regulations 2011
08-Jun-2026 | Source : BSEThe Exchange has received the disclosure under Regulation 29(2) of SEBI (Substantial Acquisition of Shares & Takeovers) Regulations 2011 for Rima Arora
Disclosures under Reg. 29(2) of SEBI (SAST) Regulations 2011
06-Jun-2026 | Source : BSEThe Exchange has received the disclosure under Regulation 29(2) of SEBI (Substantial Acquisition of Shares & Takeovers) Regulations 2011 for Rima Arora
Corporate Actions

No Upcoming Board Meetings

HB Estate Developers Ltd has declared 5% dividend, ex-date: 13 Nov 13

No Splits history available

No Bonus history available

No Rights history available
Quality key factors
Valuation key factors
Technicals key factors
 Technical Indicator Scale: Bearish, Mildly Bearish, Sideways, Mildly Bullish, Bullish Turned
 Shareholding Snapshot : Mar 2026
Shareholding Compare (%holding)
Promoters
None
Held by 8 Schemes (0.01%)
Held by 0 FIIs
Lalit Bhasin (47.75%)
Meridian Securities Private Limited (3.27%)
20.81%
Quarterly Results Snapshot (Consolidated) - Mar'26 - QoQ

QoQ Growth in quarter ended Mar 2026 is -1.46% vs 25.18% in Dec 2025
QoQ Growth in quarter ended Mar 2026 is -45.38% vs 411.81% in Dec 2025
Half Yearly Results Snapshot (Consolidated) - Sep'25
Growth in half year ended Sep 2025 is -4.81% vs 9.81% in Sep 2024
Growth in half year ended Sep 2025 is 17.86% vs 165.42% in Sep 2024
Nine Monthly Results Snapshot (Consolidated) - Dec'25
YoY Growth in nine months ended Dec 2025 is -0.59% vs 8.23% in Dec 2024
YoY Growth in nine months ended Dec 2025 is 31.03% vs 1,087.30% in Dec 2024
Annual Results Snapshot (Consolidated) - Mar'26
YoY Growth in year ended Mar 2026 is -0.65% vs 7.59% in Mar 2025
YoY Growth in year ended Mar 2026 is 8.43% vs 177.38% in Mar 2025
About HB Estate Developers Ltd

Company Coordinates


