
Compare Rajvi Logitrade with Similar Stocks
Dashboard
Strong Long Term Fundamental Strength with an average Return on Equity (ROE) of 18.46%
Healthy long term growth as Net Sales has grown by an annual rate of 150.01% and Operating profit at 37.58%
With a growth in Net Profit of 77.78%, the company declared Very Positive results in Mar 26
With ROE of 73, it has a Attractive valuation with a 3 Price to Book Value
High Institutional Holdings at 25.66%
Consistent Returns over the last 3 years
Stock DNA
Transport Services
INR 12 Cr (Micro Cap)
4.00
20
0.00%
2.57
72.96%
2.96
Total Returns (Price + Dividend) 
Rajvi Logitrade for the last several years.
Risk Adjusted Returns v/s
Returns Beta

News
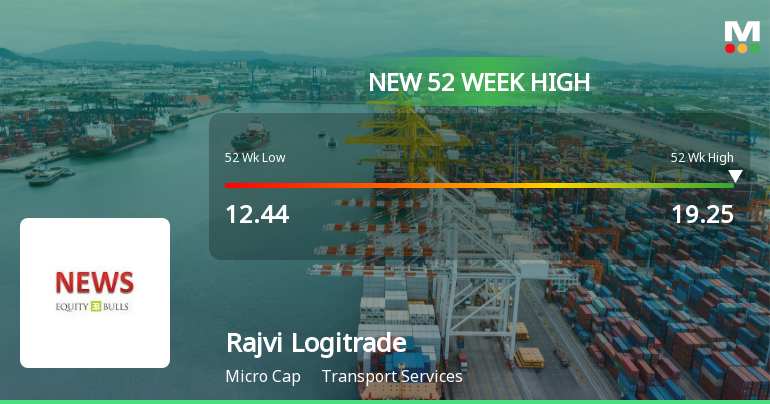
Broad-Based Technical Strength Lifts Rajvi Logitrade Ltd to 52-Week High of Rs 19.25
Surging to a fresh 52-week and all-time high of Rs 19.25 on 15 Jun 2026, Rajvi Logitrade Ltd has demonstrated remarkable price momentum, outperforming its sector and the broader market with a 54.74% gain over the past year against the Sensex’s decline of 5.51%.
Read full news article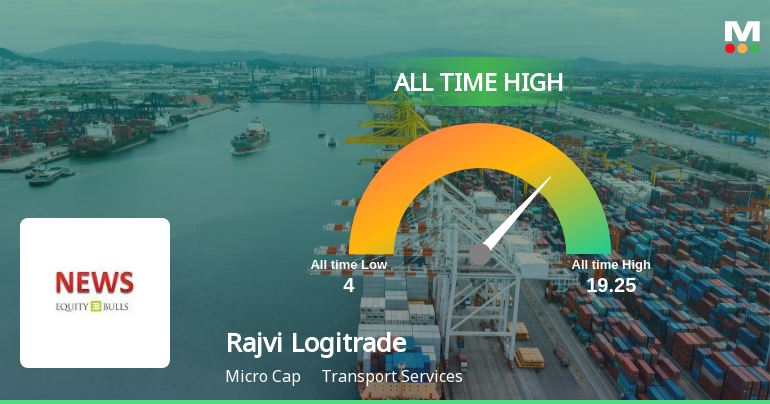
Rajvi Logitrade Ltd Hits All-Time High of Rs 19.25 as Momentum Builds Across Timeframes
Extending a remarkable rally, Rajvi Logitrade Ltd surged 4.96% on 15 Jun 2026 to touch a fresh all-time high of Rs 19.25, significantly outpacing the Sensex’s 1.55% gain and marking a new milestone for the micro-cap transport services company.
Read full news articleAre Rajvi Logitrade Ltd latest results good or bad?
Rajvi Logitrade Ltd has reported its financial results for the quarter ending December 2023, reflecting notable operational trends. The company has experienced a significant increase in net sales, which grew by 103.10% year on year, reaching Rs 12.45 crore for the half-yearly period. This growth indicates a strong sales trend for the company. In terms of profitability, Rajvi Logitrade achieved its highest operating profit in the last five quarters, amounting to Rs 0.28 crore. Additionally, the profit before tax, excluding other income, also reached Rs 0.28 crore, marking a peak for the same period. The profit after tax reached Rs 0.21 crore, which is the highest in the last five quarters, suggesting that the company is generating higher earnings for its shareholders. Furthermore, the company saw an adjustment in its evaluation over the last three months. The quarterly results for December 2025 show a net ...
Read full news article Announcements
Intimation Of Commercial Vehicle Lease Agreement Dated 01St June 2026
01-Jun-2026 | Source : BSEPursuant to Regulation 30 of SEBI (LODR) Regulations 2015 this is to inform that company has entered into commercial vehicle lease agreement with Mr. Bhupendrasinh Dalpatsinh Rana and M/S Rajvi Cargo Movers Private Limited w.e.f 01st June 2026 and canceled their Lease Agreement dated 12th February 2026.
Announcement under Regulation 30 (LODR)-Newspaper Publication
26-May-2026 | Source : BSENewspaper Advertisement of extract of Audited Financial Results for the quarter and year ended on 31st March 2026.
Board Meeting Outcome for Outcome Of Board Meeting Held On 25/05/2026
25-May-2026 | Source : BSEPursuant to Regulation 30 of the SEBI (Listing Obligations and Disclosure Requirements) Regulations 2015 this is to inform that the Board of Directors of the Company at their meeting held today i.e. Monday 25th May 2026 have considered and approved the following aspects: 1. Audited Financial Results of the Company for quarter and Financial Year ended on 31st March 2026. 2. Enhanced arrangement of hiring vehicle from Mr. Bhupendrasinh Rana and amendment to the existing lease arrangement with Rajvi Cargo Movers Private Limited. 3. Re-appointment of M/S SHAH DEEP AND COMPANY as Internal Auditor of the Company for the financial year 2026-2027. 4. Appointment of Mr. Bhupendrasinh Dalpatsinh Rana as Vice President - Logistics Operations w.e.f 01/06/2026. 5. Related party transaction for purchase of diesel from M/s Rajvi Petroleum for FY 2026-2027.
Corporate Actions

No Upcoming Board Meetings

No Dividend history available

No Splits history available

No Bonus history available

No Rights history available
Quality key factors
Valuation key factors
Technicals key factors
 Technical Indicator Scale: Bearish, Mildly Bearish, Sideways, Mildly Bullish, Bullish Turned
 Shareholding Snapshot : Mar 2026
Shareholding Compare (%holding)
Promoters
None
Held by 0 Schemes
Held by 2 FIIs (25.66%)
Maulin Bhavesh Acharya Huf (8.54%)
Polus Global Fund (15.7%)
11.45%
Quarterly Results Snapshot (Standalone) - Mar'26 - QoQ

QoQ Growth in quarter ended Mar 2026 is 18.30% vs 53.62% in Dec 2025
QoQ Growth in quarter ended Mar 2026 is 77.78% vs 523.08% in Dec 2025
Half Yearly Results Snapshot (Standalone) - Sep'25

Growth in half year ended Sep 2025 is 266.14% vs -37.23% in Sep 2024
Growth in half year ended Sep 2025 is 117.86% vs 47.37% in Sep 2024
Nine Monthly Results Snapshot (Standalone) - Dec'25
YoY Growth in nine months ended Dec 2025 is 191.79% vs -2.79% in Dec 2024
YoY Growth in nine months ended Dec 2025 is 132.79% vs 52.50% in Dec 2024
Annual Results Snapshot (Standalone) - Mar'26
YoY Growth in year ended Mar 2026 is 124.41% vs 37.95% in Mar 2025
YoY Growth in year ended Mar 2026 is 163.30% vs 41.56% in Mar 2025
About Rajvi Logitrade Ltd

Company Coordinates


