PTC India

INR
203.15
3.05 (1.52%)
BSENSE

Aug 07, 03:30 PM

BSE+NSE Vol: 1.36 cr

  • Price Points
  • Score
  • Mojo Parameters
  • Total Return
  • News and Corporate Actions
  • Key factors
  • Shareholding
  • Financials
  • CompanyCV
stock-summaryPrice Point
High/Low

1Day

52 Week

Valuation
Technical
Day's Volume

CASH

1.36 cr (43.37%) Volume

Shareholding (Jun 2026)

FII

28.88%

Held by 223 FIIs

DII

12.33%

Held by 20 DIIs

Promoter

16.22%

Why is PTC India Ltd falling/rising?

08-Aug-2026

As of 07-Aug, PTC India Ltd's stock price is rising to 203.15, with a 25.95% year-to-date increase and strong investor interest reflected in a 104.93% rise in delivery volume. The stock's positive trajectory, supported by high institutional holding and attractive valuation despite profit declines, indicates bullish sentiment.

As of 07-Aug, PTC India Ltd's stock price is rising, currently at 203.15, reflecting a change of 3.05 (1.52%) upwards. The stock has shown significant performance over various periods, with a remarkable 15.72% increase over the past week and a 17.39% rise over the past month, both outperforming the Sensex, which has seen minimal gains. Year-to-date, PTC India has achieved a 25.95% increase, contrasting sharply with the Sensex's decline of 7.89%.<BR><BR>The stock has been on a positive trajectory, gaining for the last eight consecutive days and accumulating a total return of 22.49% during this period. Today's trading also saw the stock reach an intraday high of Rs 204.25, indicating strong investor interest. Additionally, the stock is trading above its moving averages across multiple time frames, which is often a bullish signal.<BR><BR>Investor participation has notably increased, with delivery volume rising by 104.93% compared to the five-day average, suggesting heightened interest and confidence among investors. Furthermore, PTC India Ltd has a high institutional holding of 41.2%, which indicates that knowledgeable investors are backing the stock, as they typically have better resources to analyze company fundamentals.<BR><BR>Despite a decline in profits over the past year, the stock is considered to have an attractive valuation, trading at a discount compared to its peers. This combination of strong recent performance, increased investor participation, and institutional backing contributes to the rising stock price of PTC India Ltd.

View full answer

Should I buy, sell or hold PTC India Ltd?

06-Aug-2026

Has PTC India Ltd declared dividend?

06-Aug-2026

Yes, PTC India Ltd has declared a dividend of 230%, amounting to ₹3 per share, with an ex-date of August 10, 2026. The company has shown strong total returns over various periods, particularly in the long term.

PTC India Ltd has declared a dividend.<BR><BR>Dividend Details:<BR>- Percentage announced: 230%<BR>- Amount per share: 3 per share<BR>- Ex-date: 10 Aug 26<BR><BR>Dividend Yield: 1.51%.<BR><BR>Total Returns by Period:<BR>In the 3-month period, the price return was -8.46%, the dividend return was 10.32%, resulting in a total return of 1.86%.<BR><BR>In the 6-month period, the price return was 10.77%, the dividend return was 13.87%, leading to a total return of 24.64%.<BR><BR>Over the 1-year period, the price return was 10.1%, the dividend return was 14.62%, which culminated in a total return of 24.72%.<BR><BR>For the 2-year period, the price return was -1.28%, the dividend return was 22.10%, resulting in a total return of 20.82%.<BR><BR>In the 3-year period, the price return was 67.73%, the dividend return was 42.37%, yielding a total return of 110.1%.<BR><BR>During the 4-year period, the price return was 138.21%, the dividend return was 69.90%, leading to a total return of 208.11%.<BR><BR>In the 5-year period, the price return was 99.1%, the dividend return was 64.69%, resulting in a total return of 163.79%.<BR><BR>Overall, PTC India Ltd has declared a substantial dividend of 230%, and the total returns over various periods indicate a strong performance, particularly in the longer term, showcasing both price appreciation and dividend contributions.

View full answer

Are PTC India Ltd latest results good or bad?

05-Aug-2026

PTC India Ltd's latest Q1 FY27 results show a 19.07% revenue growth to ₹4,773.80 crores, but a concerning 49.76% decline in net profit to ₹97.99 crores and a significant drop in operating margin, indicating serious operational challenges despite increased sales.

PTC India Ltd's latest results for Q1 FY27 indicate a challenging performance. While the company achieved a significant revenue growth of 19.07% year-on-year, reaching ₹4,773.80 crores, this was overshadowed by a sharp decline in net profit, which fell by 49.76% to ₹97.99 crores compared to the same quarter last year. <BR><BR>The operating margin also took a hit, dropping from 7.25% to just 3.18%, reflecting a substantial compression of 407 basis points. This indicates that despite the increase in sales, the company is struggling to maintain profitability, which raises concerns about its operational efficiency and cost management.<BR><BR>Additionally, the profit after tax (PAT) margin decreased to 2.37%, down from 6.11% a year ago, highlighting ongoing challenges in converting revenue growth into profit. The reliance on other income, which accounted for a significant portion of profit before tax, further complicates the sustainability of earnings from core operations.<BR><BR>Overall, while the revenue growth is a positive sign, the dramatic decline in profitability and margin compression suggest that PTC India is facing serious operational challenges, making the latest results more concerning than encouraging.

View full answer

When is the next results date for PTC India Ltd?

28-Jul-2026

The next results date for PTC India Ltd is August 4, 2026.

The next results date for PTC India Ltd is scheduled for August 4, 2026.

View full answer

How big is PTC India?

11-Jun-2026

As of 10th June, PTC India Ltd has a market capitalization of 5,518.00 Cr, with net sales of 16,770.79 Cr and a net profit of 605.63 Cr reported in the latest four quarters. The company has shareholder's funds of 5,805.11 Cr and total assets of 12,837.78 Cr for the annual period ending March 2025.

As of 10th June, PTC India Ltd has a market capitalization of 5,518.00 Cr, categorizing it as a Small Cap company.<BR><BR>In the latest four quarters, PTC India reported net sales of 16,770.79 Cr and a net profit of 605.63 Cr.<BR><BR>For the latest annual period ending March 2025, the company had shareholder's funds amounting to 5,805.11 Cr and total assets of 12,837.78 Cr.

View full answer

Who are in the management team of PTC India?

11-Jun-2026

The management team of PTC India includes Chairman Rajib Kumar Mishra, along with a mix of non-executive and independent directors such as Sangeeta Kaushik, Devendra Swaroop Saksena, and Rashmi Verma, among others, ensuring effective governance and strategic direction.

The management team of PTC India includes the following members:<BR><BR>1. **Rajib Kumar Mishra** - Chairman / Executive Director<BR>2. **Sangeeta Kaushik** - Non Executive Director / Nomin<BR>3. **Devendra Swaroop Saksena** - Independent Non Executive Director<BR>4. **Ramesh Narain Misra** - Independent Non Executive Director<BR>5. **Prakash Mhaske** - Independent Non Executive Director<BR>6. **Mahendra Kumar Gupta** - Non Executive Director / Nomin<BR>7. **G. Ravisankar** - Non Executive Director / Nomin<BR>8. **Jayant Dasgupta** - Independent Director<BR>9. **Rashmi Verma** - Independent Director<BR>10. **Narendra Kumar** - Independent Director<BR>11. **Rajiv Ranjan Jha** - Independent Director<BR><BR>This team comprises a mix of executive and non-executive directors, including several independent directors, contributing to the governance and strategic direction of the company.

View full answer

Who are the peers of the PTC India?

11-Jun-2026

PTC India's peers include JP Power Ventures, Reliance Power, Waaree Renewables, GMR Urban, KPI Green Energy, RattanIndia Power, Reliance Infrastructure, Insolation Energy, and Gujarat Industries Power. PTC India has the highest 1-year return among its peers at 2.17%, while Reliance Power has the lowest at -63.09%.

Peers: The peers of PTC India are JP Power Ven., Reliance Power, Waaree Renewab., GMR Urban, KPI Green Energy, RattanIndia Pow., Reliance Infra., Insolation Ener, Guj Inds. Power.<BR><BR>Quality Snapshot: Excellent management risk is observed at Waaree Renewab. and Insolation Ener, while Average management risk is found at Reliance Power, KPI Green Energy, and PTC India. Below Average management risk is present at JP Power Ven., RattanIndia Pow., Reliance Infra., Guj Inds. Power, and Sustainable Ener, while GMR Urban does not qualify. Growth is Excellent for Waaree Renewab. and KPI Green Energy, Average for Reliance Power and PTC India, and Below Average for JP Power Ven., RattanIndia Pow., Reliance Infra., Guj Inds. Power, and Sustainable Ener, with GMR Urban not qualifying. Capital Structure is Excellent for Waaree Renewab., Good for Insolation Ener and Guj Inds. Power, Average for PTC India, and Below Average for JP Power Ven., Reliance Power, RattanIndia Pow., Reliance Infra., and Sustainable Ener, while KPI Green Energy does not qualify.<BR><BR>Return Snapshot: The peer with the highest 1-year return is PTC India at 2.17%, while Reliance Power has the lowest at -63.09%, indicating that PTC India outperforms its peers significantly in this regard. Additionally, several peers, including Reliance Power, KPI Green Energy, RattanIndia Pow., Reliance Infra., Insolation Ener, and Guj Inds. Power, have negative six-month returns.

View full answer

What does PTC India do?

10-Jun-2026

PTC India Ltd is a leading power trading solutions provider in India, focusing on developing a vibrant power market. As of March 2026, it reported net sales of ₹3,898 Cr and a net profit of ₹105 Cr, with a market cap of ₹5,518 Cr.

Overview:<BR>PTC India Ltd is the leading provider of power trading solutions in India, operating within the power industry and categorized as a small-cap company.<BR><BR>History:<BR>PTC India Ltd was incorporated in an unspecified year and has since focused on developing a commercially vibrant power market in India. The latest quarterly results reported net sales and net profit for the period ending March 2026.<BR><BR>Financial Snapshot:<BR>Most recent Net Sales: 3,898 Cr (Quarterly Results - Mar 2026) <BR>Most recent Net Profit: 105 Cr (Quarterly Results - Mar 2026) <BR>Market-cap value: INR 5,518 Cr (Small Cap)<BR><BR>Key Metrics:<BR>P/E: 9.00 <BR>Industry P/E: 21 <BR>Dividend Yield: 5.18% <BR>Debt Equity: -0.49 <BR>Return on Equity: 10.18% <BR>Price to Book: 0.93 <BR><BR>Contact Details:<BR>Address: 2nd Floor NBCC Tower, 15 Bhikaji Cama Place New Delhi New Delhi : 110066 <BR>Tel: 91-11-41595100/41659500 <BR>Email: info@ptcindia.com <BR>Website: http://www.ptcindia.com

View full answer

How has been the historical performance of PTC India?

13-Nov-2025

PTC India has shown fluctuating financial performance, with a decline in net sales and operating income over recent years, but a significant recovery in net profit and cash flow in March 2025, reaching 900.25 crore and 835.00 crore respectively. Total liabilities and assets also decreased during this period.

Answer:<BR>The historical performance of PTC India shows a fluctuating trend in key financial metrics over the years.<BR><BR>Breakdown:<BR>PTC India's consolidated net sales for March 2025 were reported at 15,679.49 crore, a decrease from 16,763.22 crore in March 2024 and 16,856.39 crore in March 2022, indicating a downward trend in sales over the last few years. The total operating income followed a similar pattern, with a peak of 18,345.50 crore in March 2021, gradually declining to the current figure. The company's operating profit (PBDIT) also saw a decline, reaching 1,459.59 crore in March 2025, down from 1,718.28 crore in March 2021. Profit before tax improved to 1,114.33 crore in March 2025 from 650.41 crore in March 2024, while profit after tax increased to 851.31 crore in March 2025, up from 480.17 crore in March 2024. The consolidated net profit for March 2025 was 900.25 crore, a significant rise from 476.88 crore in March 2024. On the balance sheet, total liabilities decreased to 12,837.78 crore in March 2025 from 15,040.27 crore in March 2024, reflecting a reduction in long-term borrowings. The total assets also declined to 12,837.78 crore in March 2025 from 15,040.27 crore in March 2024. Cash flow from operating activities was 2,131.00 crore in March 2025, down from 2,450.00 crore in March 2024, while the net cash inflow for March 2025 was 835.00 crore, reversing the outflow seen in the previous year. Overall, PTC India has experienced fluctuations in sales and profits, with a notable recovery in net profit and cash flow in the latest reporting period.

View full answer

Is PTC India technically bullish or bearish?

13-Nov-2025

As of November 12, 2025, PTC India's technical trend has shifted to a moderately strong bearish stance, supported by bearish indicators such as MACD, moving averages, KST, and Bollinger Bands across multiple timeframes.

As of 12 November 2025, the technical trend has changed from mildly bearish to bearish. The current stance is bearish with a moderate strength. Key indicators driving this include a bearish MACD on the weekly chart, bearish moving averages on the daily timeframe, and a bearish KST on the weekly. Additionally, Bollinger Bands indicate a mildly bearish trend on both weekly and monthly charts. The Dow Theory shows a mildly bearish signal on the weekly timeframe, further supporting the bearish outlook. Overall, the combination of these indicators suggests a negative sentiment in PTC India's technical performance.

View full answer

How has been the historical performance of PTC India?

12-Nov-2025

PTC India's historical performance shows a decline in net sales from INR 18,345.50 crore in March 2021 to INR 15,679.49 crore in March 2025, with operating profit decreasing and profit before tax improving significantly in 2025. Total assets and liabilities have also decreased, while cash and cash equivalents increased to INR 1,709.00 crore in March 2025.

Answer:<BR>The historical performance of PTC India shows fluctuations in key financial metrics over the years.<BR><BR>Breakdown:<BR>PTC India's net sales have seen a decline from INR 18,345.50 crore in March 2021 to INR 15,679.49 crore in March 2025, with a slight recovery from INR 15,673.84 crore in March 2023. Total operating income followed a similar trend, peaking in March 2021 and dropping to INR 15,679.49 crore in March 2025. The company's operating profit (PBDIT) has also decreased from INR 1,718.28 crore in March 2021 to INR 1,459.59 crore in March 2025, reflecting a declining operating profit margin from 9.5% to 5.54%. Profit before tax improved to INR 1,114.33 crore in March 2025 from INR 650.41 crore in March 2024, while profit after tax rose to INR 851.31 crore in March 2025, up from INR 480.17 crore in March 2024. The consolidated net profit increased significantly to INR 900.25 crore in March 2025 from INR 476.88 crore in March 2024. On the balance sheet, total assets decreased from INR 21,012.25 crore in March 2020 to INR 12,837.78 crore in March 2025, with total liabilities also declining from INR 21,012.25 crore to INR 12,837.78 crore in the same period. Cash flow from operating activities has shown a downward trend, dropping from INR 3,575.00 crore in March 2023 to INR 2,131.00 crore in March 2025, while the closing cash and cash equivalents increased to INR 1,709.00 crore in March 2025 from INR 860.00 crore in March 2024.

View full answer

Who are the top shareholders of the PTC India?

17-Jul-2025

The top shareholders of PTC India include Power Finance Corporation Ltd at 4.05%, LIC Life Non-par at 4.13%, and Foreign Institutional Investors holding 28.75%. Individual investors hold a significant 34.98%, indicating a majority of non-institutional shareholders.

The top shareholders of PTC India include a mix of institutional and individual investors. The largest shareholder is Power Finance Corporation Ltd, holding 4.05%. Additionally, LIC Life Non-par is the highest public shareholder with a stake of 4.13%. Foreign Institutional Investors (FIIs) collectively hold 28.75% of the shares, represented by 219 different entities. Mutual funds account for 2.01% through six schemes. Individual investors have a significant presence, holding 34.98% of the shares. Overall, the majority of shareholders are non-institutional.

View full answer

Is PTC India overvalued or undervalued?

09-Jun-2025

As of September 18, 2024, PTC India is considered very attractive due to its undervalued status with a PE ratio of 9.02, a Price to Book Value of 0.89, an EV to EBITDA of 4.14, a strong dividend yield of 7.36%, and a ROCE of 21.01%, despite underperforming the Sensex over the past year, while showing a remarkable 378.50% return over five years.

As of 18 September 2024, PTC India has moved from an attractive to a very attractive valuation grade. The company is currently considered undervalued, supported by a PE ratio of 9.02, a Price to Book Value of 0.89, and an EV to EBITDA of 4.14. These ratios suggest that PTC India is trading at a significant discount compared to its peers.<BR><BR>In comparison to notable peers, MMTC has a PE ratio of 119.39, and Elitecon International is at 131.08, indicating that PTC India is much more favorably priced within the industry. Additionally, PTC India boasts a robust dividend yield of 7.36% and a return on capital employed (ROCE) of 21.01%, further reinforcing its attractiveness as an investment. While the stock has underperformed the Sensex over the past year, its strong long-term performance, with a 378.50% return over five years, highlights its potential for future growth.

View full answer
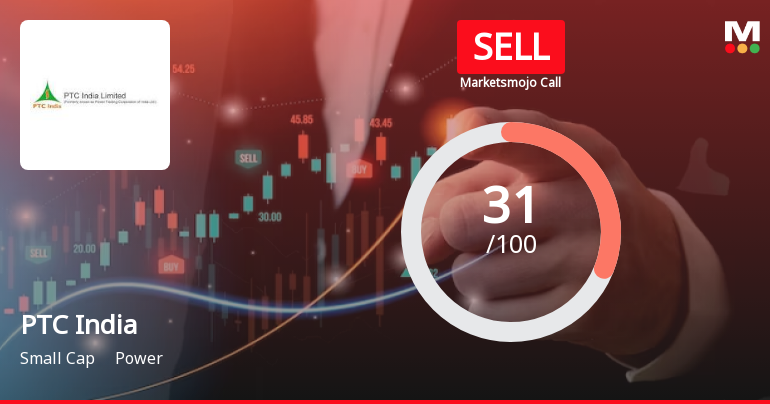
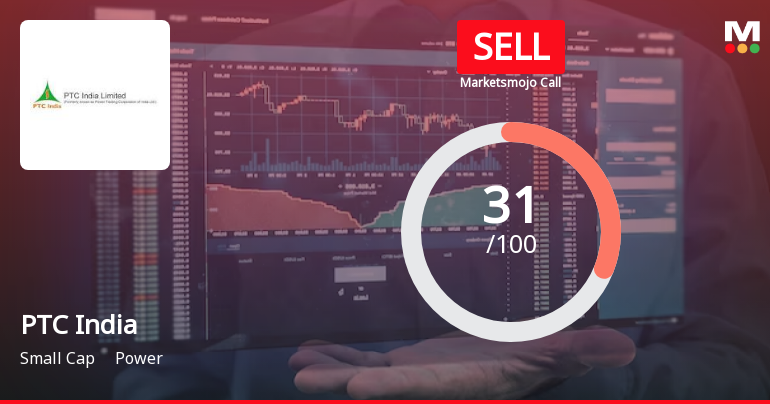
iScoreScore
Click here to find our call on this stock
Strong Sell
Sell
Hold
Buy
Strong Buy

Dashboard

1

Poor long term growth as Net Sales has grown by an annual rate of -1.25% and Operating profit at -14.40% over the last 5 years

 
2

Negative results in Jun 26

3

With ROE of 10.2, it has a Attractive valuation with a 1 Price to Book Value

4

High Institutional Holdings at 41.2%

stock-summaryMojo Parameters

Mojo Parameters

Loading Valuation Snapshot...

Stock DNA

stock-summary
Industry

Power

stock-summary
Market cap

INR 5,871 Cr (Small Cap)

stock-summary
P/E

12.00

stock-summary
Industry P/E

22

stock-summary
Dividend Yield

1.50%

stock-summary
Debt Equity

-0.49

stock-summary
Return on Equity

10.18%

stock-summary
Price to Book

0.99

Revenue and Profits:
Net Sales:
4,774 Cr
(Quarterly Results - Jun 2026)
Net Profit:
98 Cr
stock-summaryTotal Returns
Total Returns (Price + Dividend) stock-summary
Dividend Yield (1.5%)
TimePeriod
Price Return
Dividend Return
Total Return
3 Months
-10.82%
10.78%
-0.04%
6 Months
12.46%
13.87%
26.33%
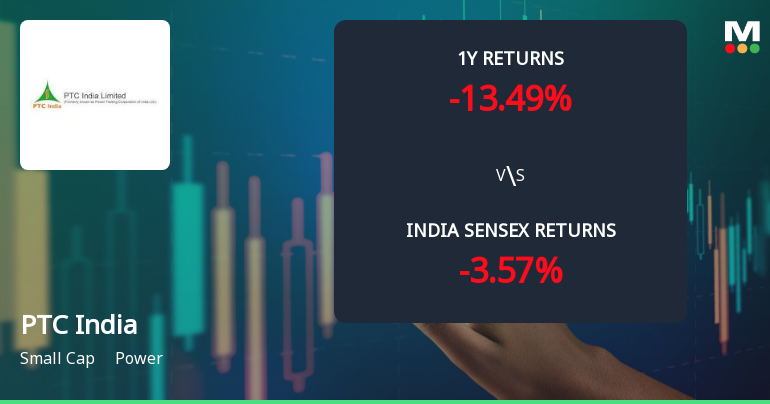
1 Year
12.36%
13.78%
26.14%
2 Years
-3.15%
21.81%
18.66%
3 Years
68.24%
42.13%
110.37%
4 Years
141.85%
69.90%
211.75%
5 Years
102.14%
61.04%
163.18%

Latest dividend: 3 per share ex-dividend date: Feb-20-2026

Risk Adjusted Returns v/s stock-summary
Returns Beta
Icon
Beta has not been calculated since enough price history is not available
stock-summaryNews & Corporate Actions

News

Announcements stock-summary

Announcement under Regulation 30 (LODR)-Analyst / Investor Meet - Outcome

05-Aug-2026 | Source : BSE

The Company has provided the audio and video link of Investor/ Analyst call held on 5th August 2026 on unaudited financial results for quarter ended 30th June 2026.

Announcement under Regulation 30 (LODR)-Newspaper Publication

05-Aug-2026 | Source : BSE

PTC India Ltd. has informed the exchange about the copy of newspaper publication of financial results for quarter ended 30th June 2026 published on 5th August 2026.

Announcement under Regulation 30 (LODR)-Investor Presentation

04-Aug-2026 | Source : BSE

PTC India Ltd. has informed about the investor presentation on unaudited financial results (standalone and consolidated) for quarter ended 30th June 2026.

Corporate Actions stock-summary

stock-summary
BOARD MEETING

No Upcoming Board Meetings

stock-summary
DIVIDEND

PTC India Ltd has declared 230% dividend, ex-date: 10 Aug 26

stock-summary
SPLITS

No Splits history available

stock-summary
BONUS

No Bonus history available

stock-summary
RIGHTS

No Rights history available

stock-summaryKey Factors

Quality key factors stock-summary

Factor
Value
Sales Growth (5y)
-1.25%
EBIT Growth (5y)
-14.40%
EBIT to Interest (avg)
2.39
Debt to EBITDA (avg)
4.26
Net Debt to Equity (avg)
-0.49
Sales to Capital Employed (avg)
1.61
Tax Ratio
25.54%
Dividend Payout Ratio
38.47%
Pledged Shares
0
Institutional Holding
41.20%
ROCE (avg)
16.61%
ROE (avg)
9.71%

Valuation key factors

Factor
Value
P/E Ratio
12
Industry P/E
22
Price to Book Value
1.01
EV to EBIT
4.24
EV to EBITDA
4.18
EV to Capital Employed
1.01
EV to Sales
0.18
PEG Ratio
NA
Dividend Yield
1.48%
ROCE (Latest)
28.33%
ROE (Latest)
10.18%

Technicals key factors

Indicator
Weekly
Monthly
MACD
Mildly Bearish
Bullish
RSI
No Signal
No Signal
Bollinger Bands
Bullish
Bullish
Moving Averages
Bullish (Daily)
KST
Mildly Bearish
Bullish
Dow Theory
Mildly Bullish
Mildly Bearish
OBV
Bullish
Bullish
stock-summary Technical Indicator Scale: Bearish, Mildly Bearish, Sideways, Mildly Bullish, Bullish  Turned 
stock-summaryShareholding
Shareholding Snapshot : Jun 2026stock-summary
Shareholding Compare (%holding) stock-summary
Majority shareholders

Non Institution

Pledged Promoter Holdings

None

Mutual Funds

Held by 10 Schemes (5.05%)

FIIs

Held by 223 FIIs (28.88%)

Promoter with highest holding

Power Finance Corporation Ltd (4.05%)

Highest Public shareholder

Lici Life Non-par (3.78%)

Individual Investors Holdings

32.61%

stock-summaryFinancial
[
  {
    "link": "quarterly",
    "btn_text": "All Quarterly Results",
    "header": "Quarterly Results Snapshot (Consolidated) - Jun'26 - YoY",
    "rhs": [
      {
        "prefix": "Net Sales ",
        "suffix": "YoY Growth in quarter ended Jun 2026 is 19.07% vs -11.98% in Jun 2025",
        "dir": 1
      },
      {
        "prefix": "Consolidated Net Profit ",
        "suffix": "YoY Growth in quarter ended Jun 2026 is -49.76% vs 12.16% in Jun 2025",
        "dir": -1
      }
    ],
    "table": {
      "header": [
        "Jun'26",
        "Jun'25",
        "Change(%)"
      ],
      "body": [
        {
          "field": "Net Sales",
          "val1": "4,773.80",
          "val2": "4,009.17",
          "chgp": "19.07%",
          "chgp_class": "positive"
        },
        {
          "field": "Operating Profit (PBDIT) excl Other Income",
          "val1": "150.54",
          "val2": "288.24",
          "chgp": "-47.77%",
          "chgp_class": "negative"
        },
        {
          "field": "Interest",
          "val1": "51.98",
          "val2": "92.20",
          "chgp": "-43.62%",
          "chgp_class": "positive"
        },
        {
          "field": "Exceptional Items",
          "val1": "0.00",
          "val2": "0.00",
          "chgp": "",
          "chgp_class": "neutral"
        },
        {
          "field": "Consolidate Net Profit",
          "val1": "97.99",
          "val2": "195.05",
          "chgp": "-49.76%",
          "chgp_class": "negative"
        },
        {
          "field": "Operating Profit Margin (Excl OI)",
          "val1": "3.18%",
          "val2": "7.25%",
          "chgp": "-4.07%",
          "chgp_class": "negative"
        }
      ]
    }
  },
  {
    "link": "half-yearly",
    "btn_text": "All Half Yearly Results",
    "header": "Half Yearly Results Snapshot (Consolidated) - Sep'25",
    "rhs": [
      {
        "prefix": "Net Sales ",
        "suffix": " Growth in half year ended Sep 2025 is -3.52% vs -0.14% in Sep 2024",
        "dir": -1
      },
      {
        "prefix": "Consolidated Net Profit ",
        "suffix": " Growth in half year ended Sep 2025 is -1.25% vs 25.68% in Sep 2024",
        "dir": -1
      }
    ],
    "table": {
      "header": [
        "Sep'25",
        "Sep'24",
        "Change(%)"
      ],
      "body": [
        {
          "field": "Net Sales",
          "val1": "9,467.90",
          "val2": "9,813.58",
          "chgp": "-3.52%",
          "chgp_class": "negative"
        },
        {
          "field": "Operating Profit (PBDIT) excl Other Income",
          "val1": "563.66",
          "val2": "610.22",
          "chgp": "-7.63%",
          "chgp_class": "negative"
        },
        {
          "field": "Interest",
          "val1": "193.53",
          "val2": "193.25",
          "chgp": "0.14%",
          "chgp_class": "negative"
        },
        {
          "field": "Exceptional Items",
          "val1": "0.00",
          "val2": "109.72",
          "chgp": "-100.00%",
          "chgp_class": "negative"
        },
        {
          "field": "Consolidate Net Profit",
          "val1": "386.24",
          "val2": "391.14",
          "chgp": "-1.25%",
          "chgp_class": "negative"
        },
        {
          "field": "Operating Profit Margin (Excl OI)",
          "val1": "6.00%",
          "val2": "6.51%",
          "chgp": "-0.51%",
          "chgp_class": "negative"
        }
      ]
    }
  },
  {
    "link": "nine-monthly",
    "btn_text": "All Nine Monthly Results",
    "header": "Nine Monthly Results Snapshot (Consolidated) - Dec'25",
    "rhs": [
      {
        "prefix": "Net Sales ",
        "suffix": "YoY Growth in nine months ended Dec 2025 is -2.73% vs -0.16% in Dec 2024",
        "dir": -1
      },
      {
        "prefix": "Consolidated Net Profit ",
        "suffix": "YoY Growth in nine months ended Dec 2025 is -8.83% vs 40.48% in Dec 2024",
        "dir": -1
      }
    ],
    "table": {
      "header": [
        "Dec'25",
        "Dec'24",
        "Change(%)"
      ],
      "body": [
        {
          "field": "Net Sales",
          "val1": "12,873.27",
          "val2": "13,234.39",
          "chgp": "-2.73%",
          "chgp_class": "negative"
        },
        {
          "field": "Operating Profit (PBDIT) excl Other Income",
          "val1": "737.71",
          "val2": "919.81",
          "chgp": "-19.80%",
          "chgp_class": "negative"
        },
        {
          "field": "Interest",
          "val1": "257.37",
          "val2": "277.81",
          "chgp": "-7.36%",
          "chgp_class": "positive"
        },
        {
          "field": "Exceptional Items",
          "val1": "-4.35",
          "val2": "114.40",
          "chgp": "-103.80%",
          "chgp_class": "negative"
        },
        {
          "field": "Consolidate Net Profit",
          "val1": "500.29",
          "val2": "548.74",
          "chgp": "-8.83%",
          "chgp_class": "negative"
        },
        {
          "field": "Operating Profit Margin (Excl OI)",
          "val1": "5.73%",
          "val2": "6.95%",
          "chgp": "-1.22%",
          "chgp_class": "negative"
        }
      ]
    }
  },
  {
    "link": "annual",
    "btn_text": "All Annual Results",
    "header": "Annual Results Snapshot (Consolidated) - Mar'26",
    "rhs": [
      {
        "prefix": "Net Sales ",
        "suffix": "YoY Growth in year ended Mar 2026 is 6.96% vs -6.46% in Mar 2025",
        "dir": 1
      },
      {
        "prefix": "Consolidated Net Profit ",
        "suffix": "YoY Growth in year ended Mar 2026 is -32.73% vs 88.78% in Mar 2025",
        "dir": -1
      }
    ],
    "table": {
      "header": [
        "Mar'26",
        "Mar'25",
        "Change(%)"
      ],
      "body": [
        {
          "field": "Net Sales",
          "val1": "16,770.79",
          "val2": "15,679.49",
          "chgp": "6.96%",
          "chgp_class": "positive"
        },
        {
          "field": "Operating Profit (PBDIT) excl Other Income",
          "val1": "882.67",
          "val2": "861.86",
          "chgp": "2.41%",
          "chgp_class": "positive"
        },
        {
          "field": "Interest",
          "val1": "310.36",
          "val2": "641.91",
          "chgp": "-51.65%",
          "chgp_class": "positive"
        },
        {
          "field": "Exceptional Items",
          "val1": "-4.35",
          "val2": "428.47",
          "chgp": "-101.02%",
          "chgp_class": "negative"
        },
        {
          "field": "Consolidate Net Profit",
          "val1": "605.63",
          "val2": "900.25",
          "chgp": "-32.73%",
          "chgp_class": "negative"
        },
        {
          "field": "Operating Profit Margin (Excl OI)",
          "val1": "5.31%",
          "val2": "5.54%",
          "chgp": "-0.23%",
          "chgp_class": "negative"
        }
      ]
    }
  }
]

Quarterly Results Snapshot (Consolidated) - Jun'26 - YoYstock-summary

Jun'26
Jun'25
Change(%)
Net Sales
4,773.80
4,009.17
19.07%
Operating Profit (PBDIT) excl Other Income
150.54
288.24
-47.77%
Interest
51.98
92.20
-43.62%
Exceptional Items
0.00
0.00
Consolidate Net Profit
97.99
195.05
-49.76%
Operating Profit Margin (Excl OI)
3.18%
7.25%
-4.07%
Values in Rs Cr.
Direction Arrows
Net Sales

YoY Growth in quarter ended Jun 2026 is 19.07% vs -11.98% in Jun 2025

Direction Arrows
Consolidated Net Profit

YoY Growth in quarter ended Jun 2026 is -49.76% vs 12.16% in Jun 2025

Half Yearly Results Snapshot (Consolidated) - Sep'25stock-summary

Sep'25
Sep'24
Change(%)
Net Sales
9,467.90
9,813.58
-3.52%
Operating Profit (PBDIT) excl Other Income
563.66
610.22
-7.63%
Interest
193.53
193.25
0.14%
Exceptional Items
0.00
109.72
-100.00%
Consolidate Net Profit
386.24
391.14
-1.25%
Operating Profit Margin (Excl OI)
6.00%
6.51%
-0.51%
Values in Rs Cr.
Direction Arrows
Net Sales

Growth in half year ended Sep 2025 is -3.52% vs -0.14% in Sep 2024

Direction Arrows
Consolidated Net Profit

Growth in half year ended Sep 2025 is -1.25% vs 25.68% in Sep 2024

Nine Monthly Results Snapshot (Consolidated) - Dec'25stock-summary

Dec'25
Dec'24
Change(%)
Net Sales
12,873.27
13,234.39
-2.73%
Operating Profit (PBDIT) excl Other Income
737.71
919.81
-19.80%
Interest
257.37
277.81
-7.36%
Exceptional Items
-4.35
114.40
-103.80%
Consolidate Net Profit
500.29
548.74
-8.83%
Operating Profit Margin (Excl OI)
5.73%
6.95%
-1.22%
Values in Rs Cr.
Direction Arrows
Net Sales

YoY Growth in nine months ended Dec 2025 is -2.73% vs -0.16% in Dec 2024

Direction Arrows
Consolidated Net Profit

YoY Growth in nine months ended Dec 2025 is -8.83% vs 40.48% in Dec 2024

Annual Results Snapshot (Consolidated) - Mar'26stock-summary

Mar'26
Mar'25
Change(%)
Net Sales
16,770.79
15,679.49
6.96%
Operating Profit (PBDIT) excl Other Income
882.67
861.86
2.41%
Interest
310.36
641.91
-51.65%
Exceptional Items
-4.35
428.47
-101.02%
Consolidate Net Profit
605.63
900.25
-32.73%
Operating Profit Margin (Excl OI)
5.31%
5.54%
-0.23%
Values in Rs Cr.
Direction Arrows
Net Sales

YoY Growth in year ended Mar 2026 is 6.96% vs -6.46% in Mar 2025

Direction Arrows
Consolidated Net Profit

YoY Growth in year ended Mar 2026 is -32.73% vs 88.78% in Mar 2025

stock-summaryCompany CV
About PTC India Ltd stock-summary
stock-summary
PTC India Ltd
Small Cap
Power
PTC India Limited (PTC) is the leading provider of power trading solutions in India. Its primary focus is to develop a commercially vibrant power market in the country. PTC India's subsidiary PTC India Financial Services Limited (PFS) provides total financing solutions to the energy value chain. PTC India holds 65% stake in PFS. PTC India's wholly owned subsidiary PTC Energy Limited has renewable energy portfolio of 288.
Company Coordinates stock-summary
Company Details
2nd Floor NBCC Tower, 15 Bhikaji Cama Place New Delhi New Delhi : 110066
stock-summary
Tel: 91-11-41595100/41659500
stock-summary
info@ptcindia.com
Registrar Details
MCS Ltd , F-65, , Okhla Industrial Area, Phase - I, New Delhi