
Compare Zenith Exports with Similar Stocks
Dashboard
With a Operating Losses, the company has a Weak Long Term Fundamental Strength
- Poor long term growth as Net Sales has grown by an annual rate of 5.33% and Operating profit at 13.21% over the last 5 years
- Company's ability to service its debt is weak with a poor EBIT to Interest (avg) ratio of -1.91
Risky - Negative Operating Profits
Stock DNA
Diversified consumer products
INR 98 Cr (Micro Cap)
47.00
23
0.00%
-0.26
2.51%
1.20
Total Returns (Price + Dividend) 
Zenith Exports for the last several years.
Risk Adjusted Returns v/s
Returns Beta

News
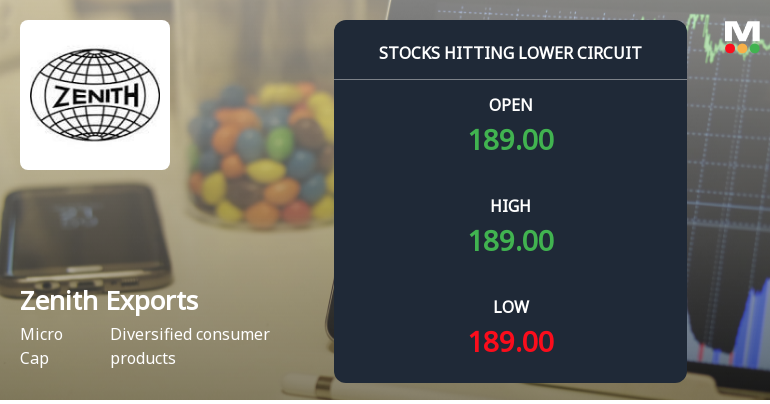
Zenith Exports Ltd Locks at Lower Circuit With 4.26% Loss — Sellers Queue, No Buyers in Sight
At Rs 180, Zenith Exports Ltd locked at its lower circuit on 23 Mar 2026, falling 4.26% within a 5% price band. Sellers were lined up to exit, but buyers were absent, resulting in unfilled supply and a frozen price that capped losses for the day.
Read full news article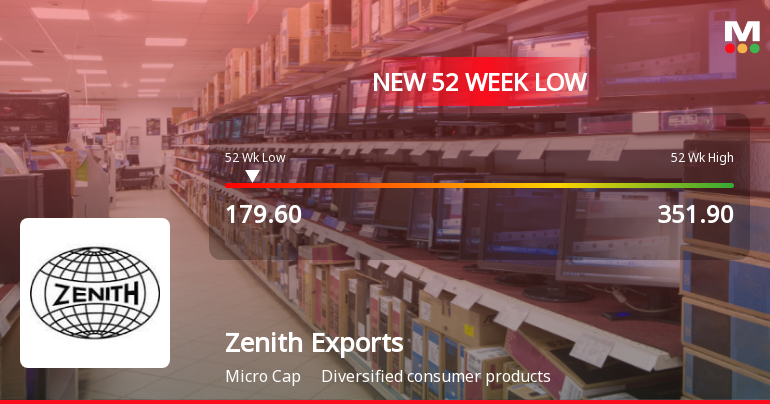
Zenith Exports Ltd Stock Falls to 52-Week Low Amidst Weak Fundamentals
Zenith Exports Ltd, a player in the diversified consumer products sector, has recently touched its 52-week low, reflecting a significant decline in its stock price amid subdued market performance and persistent financial headwinds.
Read full news article
Zenith Exports Ltd Plunges to Lower Circuit Amid Heavy Selling Pressure
Shares of Zenith Exports Ltd, a micro-cap player in the diversified consumer products sector, plunged to their lower circuit limit on 16 Mar 2026, closing at ₹182.5, down 5.0% on the day. The stock’s sharp fall was driven by intense selling pressure and panic among investors, pushing it close to its 52-week low and underperforming both its sector and the broader market.
Read full news article Announcements
Announcement under Regulation 30 (LODR)-Change in Management
19-Mar-2026 | Source : BSEIntimation of resignation of Mr. Subhajeet Kar Independent director
Announcement under Regulation 30 (LODR)-Resignation of Director
19-Mar-2026 | Source : BSEintimation for resignation of Mr. Subhajeet Kar independent Director
Announcement under Regulation 30 (LODR)-Cessation
07-Mar-2026 | Source : BSEIntimation of Cessation due to death of Mr. Sanjay Kumar Shaw
Corporate Actions

No Upcoming Board Meetings

No Dividend history available

No Splits history available

No Bonus history available

No Rights history available
Quality key factors
Valuation key factors
Technicals key factors
 Technical Indicator Scale: Bearish, Mildly Bearish, Sideways, Mildly Bullish, Bullish Turned
 Shareholding Snapshot : Dec 2025
Shareholding Compare (%holding)
Non Institution
None
Held by 0 Schemes
Held by 0 FIIs
Surendra Kumar Loyalka Huf (10.4%)
Omkara Vincom Private Limited (11.74%)
15.52%
Quarterly Results Snapshot (Standalone) - Dec'25 - QoQ

QoQ Growth in quarter ended Dec 2025 is -27.37% vs 8.99% in Sep 2025
QoQ Growth in quarter ended Dec 2025 is -79.76% vs -40.00% in Sep 2025
Half Yearly Results Snapshot (Standalone) - Sep'25

Growth in half year ended Sep 2025 is 14.61% vs -24.90% in Sep 2024
Growth in half year ended Sep 2025 is 214.29% vs -313.04% in Sep 2024
Nine Monthly Results Snapshot (Standalone) - Dec'25
YoY Growth in nine months ended Dec 2025 is 0.72% vs -17.18% in Dec 2024
YoY Growth in nine months ended Dec 2025 is 286.82% vs -279.17% in Dec 2024
Annual Results Snapshot (Standalone) - Mar'25
YoY Growth in year ended Mar 2025 is -11.75% vs 31.22% in Mar 2024
YoY Growth in year ended Mar 2025 is 470.00% vs -81.01% in Mar 2024
About Zenith Exports Ltd

Company Coordinates


