
Compare Datamatics Glob. with Similar Stocks
Dashboard
The company is Net-Debt Free
Poor long term growth as Net Sales has grown by an annual rate of 11.58% over the last 5 years
The company has declared Positive results for the last 3 consecutive quarters
With ROE of 15.8, it has a Fair valuation with a 3.1 Price to Book Value
Despite the size of the company, domestic mutual funds hold only 0.3% of the company
Market Beating performance in long term as well as near term
Stock DNA
Computers - Software & Consulting
INR 4,758 Cr (Small Cap)
19.00
20
0.61%
-0.22
15.81%
3.12
Total Returns (Price + Dividend) 
Latest dividend: 5 per share ex-dividend date: Sep-11-2025
Risk Adjusted Returns v/s
Returns Beta

News
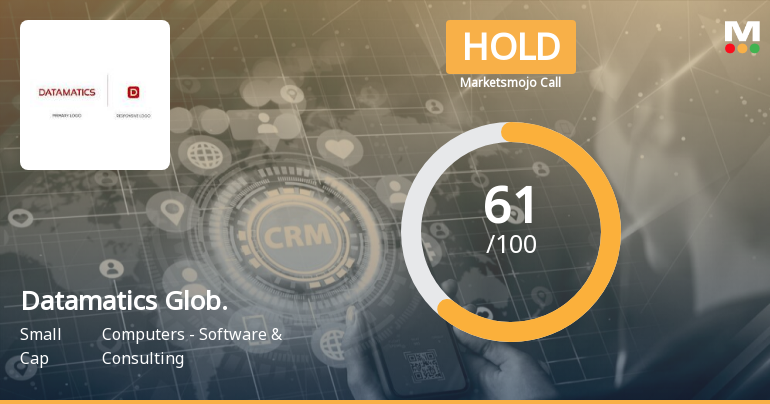
Datamatics Global Services Ltd is Rated Hold
Datamatics Global Services Ltd is rated 'Hold' by MarketsMOJO, with this rating last updated on 08 June 2026. However, the analysis and financial metrics discussed here reflect the stock's current position as of 20 June 2026, providing investors with the latest insights into its performance and outlook.
Read full news article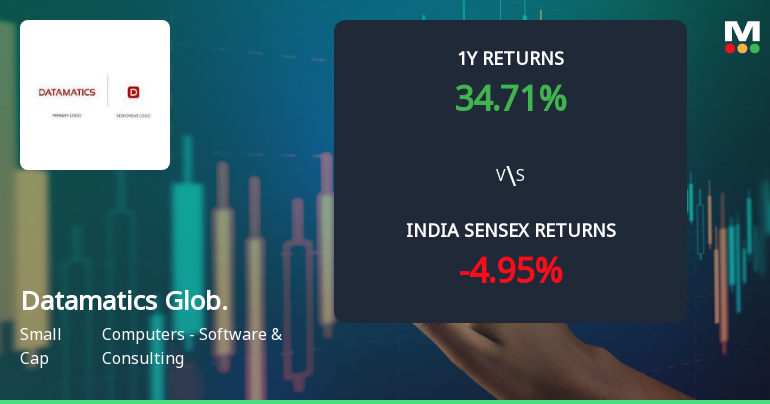
Datamatics Global Services Ltd Shows Renewed Momentum Amid Mixed Technical Signals
Datamatics Global Services Ltd has exhibited a notable shift in price momentum, transitioning from a sideways trend to a mildly bullish stance, supported by a blend of technical indicators that suggest cautious optimism for investors. The stock’s recent performance, coupled with evolving technical signals, paints a nuanced picture of its near-term prospects within the Computers - Software & Consulting sector.
Read full news article
Datamatics Global Services Ltd: Technical Momentum Shifts Amid Mixed Indicator Signals
Datamatics Global Services Ltd has experienced a notable shift in its technical parameters, reflecting a complex interplay of bullish and bearish signals across multiple timeframes. The stock’s recent price momentum and technical indicator readings suggest a transition from a mildly bullish trend to a sideways movement, prompting a reassessment of its near-term outlook within the Computers - Software & Consulting sector.
Read full news article Announcements
Announcement under Regulation 30 (LODR)-Newspaper Publication
11-Jun-2026 | Source : BSENotice to equity shareholders regarding transfer of equity shares of the Company to IEPF.
Announcement under Regulation 30 (LODR)-Analyst / Investor Meet - Intimation
05-Jun-2026 | Source : BSEPlease refer attached Intimation of Analyst Meet scheduled to be held on June 10 2026
Announcement under Regulation 30 (LODR)-Newspaper Publication
01-Jun-2026 | Source : BSENewspaper Publication regarding the Notice of Postal Ballot
Corporate Actions

No Upcoming Board Meetings

Datamatics Global Services Ltd has declared 100% dividend, ex-date: 11 Sep 25

No Splits history available

No Bonus history available

No Rights history available
Quality key factors
Valuation key factors
Technicals key factors
 Technical Indicator Scale: Bearish, Mildly Bearish, Sideways, Mildly Bullish, Bullish Turned
 Shareholding Snapshot : Mar 2026
Shareholding Compare (%holding)
Promoters
None
Held by 5 Schemes (0.1%)
Held by 40 FIIs (0.48%)
Sameer Lalit Kanodia (21.56%)
Universal Trustees Private Limited (7.78%)
21.05%
Quarterly Results Snapshot (Consolidated) - Mar'26 - QoQ

QoQ Growth in quarter ended Mar 2026 is 1.80% vs 4.05% in Dec 2025

QoQ Growth in quarter ended Mar 2026 is 21.52% vs -42.47% in Dec 2025
Half Yearly Results Snapshot (Consolidated) - Sep'25
Growth in half year ended Sep 2025 is 19.61% vs 4.28% in Sep 2024
Growth in half year ended Sep 2025 is 32.35% vs -17.72% in Sep 2024
Nine Monthly Results Snapshot (Consolidated) - Dec'25
YoY Growth in nine months ended Dec 2025 is 19.71% vs 7.83% in Dec 2024
YoY Growth in nine months ended Dec 2025 is -6.34% vs 9.97% in Dec 2024
Annual Results Snapshot (Consolidated) - Mar'26
YoY Growth in year ended Mar 2026 is 15.31% vs 11.19% in Mar 2025
YoY Growth in year ended Mar 2026 is -5.27% vs 3.45% in Mar 2025
About Datamatics Global Services Ltd

Company Coordinates


