
Compare Voith Paper with Similar Stocks
Dashboard
Poor long term growth as Net Sales has grown by an annual rate of 12.01% and Operating profit at 8.03% over the last 5 years
Negative results in Mar 26
With ROE of 11.2, it has a Expensive valuation with a 1.6 Price to Book Value
Despite the size of the company, domestic mutual funds hold only 0% of the company
Consistent Underperformance against the benchmark over the last 3 years
Stock DNA
Garments & Apparels
INR 650 Cr (Micro Cap)
14.00
26
0.68%
-0.56
11.18%
1.61
Total Returns (Price + Dividend) 
Latest dividend: 10 per share ex-dividend date: Aug-08-2025
Risk Adjusted Returns v/s
Returns Beta

News

Voith Paper Fabrics India Ltd is Rated Strong Sell
Voith Paper Fabrics India Ltd is rated Strong Sell by MarketsMOJO. This rating was last updated on 20 May 2026, reflecting a reassessment of the stock’s outlook. However, all fundamentals, returns, and financial metrics discussed here are current as of 20 June 2026, providing investors with the latest perspective on the company’s position.
Read full news article
Voith Paper Fabrics India Ltd is Rated Strong Sell
Voith Paper Fabrics India Ltd is rated Strong Sell by MarketsMOJO, with this rating last updated on 20 May 2026. However, the analysis and financial metrics discussed here reflect the stock's current position as of 09 June 2026, providing investors with the most up-to-date view of the company’s fundamentals, returns, and market performance.
Read full news article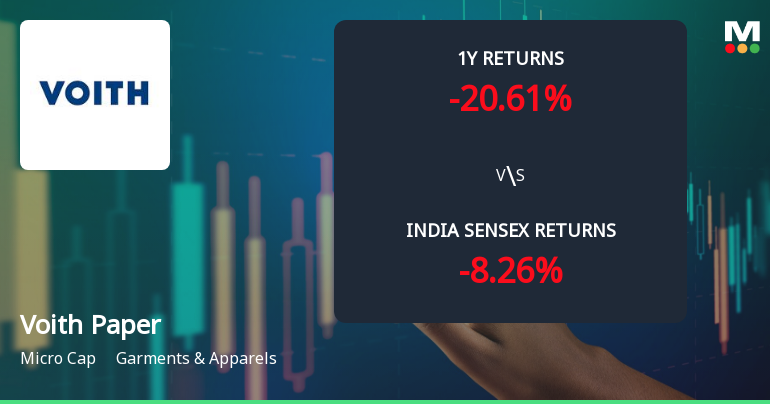
Voith Paper Fabrics India Ltd Faces Bearish Momentum Amid Technical Downturn
Voith Paper Fabrics India Ltd, a micro-cap player in the Garments & Apparels sector, has experienced a notable shift in its technical momentum, signalling increased bearishness. Recent technical indicators reveal a deteriorating trend, with the company’s Mojo Grade downgraded from Sell to Strong Sell as of 18 Nov 2025, reflecting growing investor caution amid a 2.20% decline in the latest trading session.
Read full news article Announcements
Closure of Trading Window
25-Jun-2026 | Source : BSEIntimation for Closure of Trading Window for quarter ending 30/06/2026.
Announcement under Regulation 30 (LODR)-Newspaper Publication
04-Jun-2026 | Source : BSENewspaper advertisements about opening of special window for re-lodgement of transfer requests of physical shares.
Announcement under Regulation 30 (LODR)-Newspaper Publication
22-May-2026 | Source : BSEStatement of Standalone Audited Financial Results for the fourth quarter and year ended on 31/03/2026 as published in newspapers.
Corporate Actions

No Upcoming Board Meetings

Voith Paper Fabrics India Ltd has declared 100% dividend, ex-date: 08 Aug 25

No Splits history available

No Bonus history available

No Rights history available
Quality key factors
Valuation key factors
Technicals key factors
 Technical Indicator Scale: Bearish, Mildly Bearish, Sideways, Mildly Bullish, Bullish Turned
 Shareholding Snapshot : Mar 2026
Shareholding Compare (%holding)
Promoters
None
Held by 0 Schemes
Held by 0 FIIs
Vp Auslandsbeteiligungen Gmbh (74.04%)
Om Prakash Rawat (1.37%)
20.54%
Quarterly Results Snapshot (Standalone) - Mar'26 - QoQ

QoQ Growth in quarter ended Mar 2026 is 7.16% vs -6.67% in Dec 2025
QoQ Growth in quarter ended Mar 2026 is 11.72% vs -28.91% in Dec 2025
Half Yearly Results Snapshot (Standalone) - Sep'25
Growth in half year ended Sep 2025 is 10.36% vs 4.15% in Sep 2024
Growth in half year ended Sep 2025 is 17.38% vs 6.42% in Sep 2024
Nine Monthly Results Snapshot (Standalone) - Dec'25
YoY Growth in nine months ended Dec 2025 is 13.46% vs 2.58% in Dec 2024
YoY Growth in nine months ended Dec 2025 is 13.13% vs -1.14% in Dec 2024
Annual Results Snapshot (Standalone) - Mar'26
YoY Growth in year ended Mar 2026 is 10.91% vs 5.94% in Mar 2025

YoY Growth in year ended Mar 2026 is 3.91% vs 9.92% in Mar 2025
About Voith Paper Fabrics India Ltd

Company Coordinates


