
Compare WEP Solutions with Similar Stocks
Dashboard
Company has a Debt to Equity ratio (avg) of 0.02 times
Poor long term growth as Net Sales has grown by an annual rate of 1.77% over the last 5 years
The company has declared positive results in Mar'2026 after 3 consecutive negative quarters
With ROE of 3.2, it has a Very Expensive valuation with a 1.4 Price to Book Value
Majority shareholders : Non Institution
Underperformed the market in the last 1 year
Stock DNA
Computers - Software & Consulting
INR 92 Cr (Micro Cap)
45.00
20
1.99%
0.06
3.24%
1.45
Total Returns (Price + Dividend) 
Latest dividend: 0.5 per share ex-dividend date: Aug-22-2025
Risk Adjusted Returns v/s
Returns Beta

News
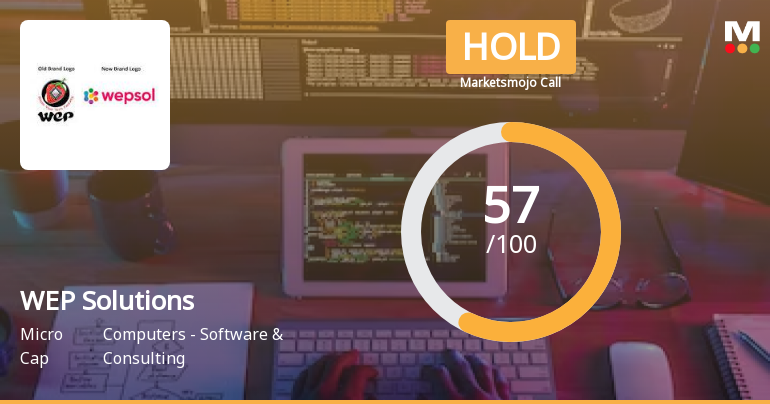
WEP Solutions Ltd is Rated Hold by MarketsMOJO
WEP Solutions Ltd is rated 'Hold' by MarketsMOJO, with this rating last updated on 05 June 2026. However, the analysis and financial metrics discussed here reflect the stock's current position as of 19 June 2026, providing investors with an up-to-date perspective on the company’s performance and outlook.
Read full news article
WEP Solutions Ltd Upgraded to Hold on Technical and Financial Improvements
WEP Solutions Ltd, a micro-cap player in the Computers - Software & Consulting sector, has seen its investment rating upgraded from Sell to Hold as of 5 June 2026. This change reflects a nuanced improvement across technical indicators, financial trends, valuation metrics, and overall quality assessments, signalling a cautious but positive outlook for investors.
Read full news article
WEP Solutions Ltd is Rated Sell
WEP Solutions Ltd is rated 'Sell' by MarketsMOJO, with this rating last updated on 11 May 2026. However, the analysis and financial metrics discussed here reflect the stock’s current position as of 04 June 2026, providing investors with an up-to-date view of the company’s fundamentals, valuation, financial trends, and technical outlook.
Read full news article Announcements
Closure of Trading Window
22-Jun-2026 | Source : BSEClosure of Trading Window for Quarter ended 30th June 2026.
Clarification Regarding Board Meeting Outcome - Intimation Of Commencement And Conclusion Time
02-Jun-2026 | Source : BSEThe Board Meeting held on 01st June 2026 commenced at 10:30 A.M. and concluded at 1:00 P.M.
Announcement under Regulation 30 (LODR)-Change in Management
01-Jun-2026 | Source : BSEAppointment of Senior Management Personnel - Chief Operating Officer
Corporate Actions

No Upcoming Board Meetings

WEP Solutions Ltd has declared 5% dividend, ex-date: 22 Aug 25

No Splits history available

No Bonus history available

WEP Solutions Ltd has announced 3:8 rights issue, ex-date: 10 Mar 21
Quality key factors
Valuation key factors
Technicals key factors
 Technical Indicator Scale: Bearish, Mildly Bearish, Sideways, Mildly Bullish, Bullish Turned
 Shareholding Snapshot : Mar 2026
Shareholding Compare (%holding)
Non Institution
None
Held by 0 Schemes
Held by 0 FIIs
Wep Periphrals Limited (16.67%)
Resident Individual Holding Upto 2 Lacs (16.68%)
45.52%
Quarterly Results Snapshot (Standalone) - Mar'26 - QoQ

QoQ Growth in quarter ended Mar 2026 is 6.58% vs -5.26% in Dec 2025
QoQ Growth in quarter ended Mar 2026 is 3,866.67% vs -90.00% in Dec 2025
Half Yearly Results Snapshot (Standalone) - Sep'25
Growth in half year ended Sep 2025 is 9.38% vs -5.77% in Sep 2024

Growth in half year ended Sep 2025 is -63.48% vs 29.94% in Sep 2024
Nine Monthly Results Snapshot (Standalone) - Dec'25
YoY Growth in nine months ended Dec 2025 is 7.64% vs -8.16% in Dec 2024
YoY Growth in nine months ended Dec 2025 is -72.20% vs 12.19% in Dec 2024
Annual Results Snapshot (Standalone) - Mar'26
YoY Growth in year ended Mar 2026 is 4.81% vs -5.88% in Mar 2025
YoY Growth in year ended Mar 2026 is -48.88% vs 4.13% in Mar 2025
About WEP Solutions Ltd

Company Coordinates


