
Compare Sonal Mercantile with Similar Stocks
Stock DNA
Non Banking Financial Company (NBFC)
INR 137 Cr (Micro Cap)
5.00
9
0.00%
0.76
6.66%
0.34
Total Returns (Price + Dividend) 
Sonal Mercantile for the last several years.
Risk Adjusted Returns v/s
Returns Beta

News

Sonal Mercantile Ltd Locks at Lower Circuit With 5.0% Loss — Sellers Queue, No Buyers in Sight
At Rs 88.06, sellers were still queuing — but there were no buyers willing to take the other side. Sonal Mercantile Ltd locked at its lower circuit of 5.0% on 30 Jul 2026, with unfilled sell orders and a frozen price, signalling persistent selling pressure in a thinly traded micro-cap stock.
Read full news article
Sonal Mercantile Ltd is Rated Sell
Sonal Mercantile Ltd is rated 'Sell' by MarketsMOJO, with this rating last updated on 01 June 2026. However, the analysis and financial metrics discussed here reflect the company’s current position as of 30 July 2026, providing investors with the latest insights into the stock’s fundamentals, valuation, financial trends, and technical outlook.
Read full news article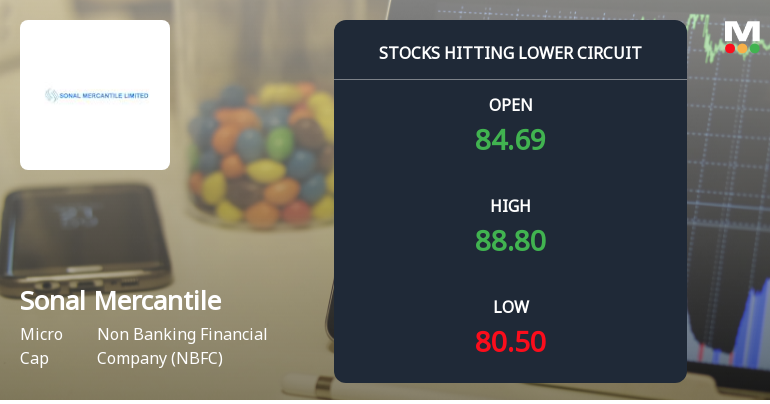
Sonal Mercantile Ltd Locks at Lower Circuit With 5.0% Loss — Sellers Queue, No Buyers in Sight
At Rs 90.08, sellers were still queuing — but there were no buyers willing to take the other side. Sonal Mercantile Ltd locked at its lower circuit of 5.0% on 27 Jul 2026, with unfilled sell orders and a frozen price.
Read full news article Announcements
Compliances-Certificate under Reg. 74 (5) of SEBI (DP) Regulations 2018
06-Jul-2026 | Source : BSEEnclosed certificate under Regulation 74 (5) of the SEBI (Depositories and participant) Regulations 2018 for quarter ended June 30 2026.
Closure of Trading Window
22-Jun-2026 | Source : BSEThe trading window for dealing in the Securities of the company will be closed for Designated persons and their immediate relatives from Wednesday 1st july 2026 and same remain closed till 48 hours after announcement of financial results for the quarter ending 30th June 2026 to the stock exchange.
Announcement under Regulation 30 (LODR)-Newspaper Publication
01-Jun-2026 | Source : BSEEnclosed Newspaper publication of Audited standalone and consolidated Financial results for financial year ended 31.03.2026
Corporate Actions

No Upcoming Board Meetings

No Dividend history available

No Splits history available

No Bonus history available

No Rights history available
Quality key factors
Valuation key factors
Technicals key factors
 Technical Indicator Scale: Bearish, Mildly Bearish, Sideways, Mildly Bullish, Bullish Turned
 Shareholding Snapshot : Jun 2026
Shareholding Compare (%holding)
Non Institution
None
Held by 0 Schemes
Held by 0 FIIs
Ram Gopal Goyal & Sons Llp (24.92%)
Rudraveerya Developers Limited (24.74%)
26.47%
Quarterly Results Snapshot (Consolidated) - Mar'26 - QoQ

QoQ Growth in quarter ended Mar 2026 is 61.86% vs -15.63% in Dec 2025
QoQ Growth in quarter ended Mar 2026 is 172.48% vs -66.19% in Dec 2025
Half Yearly Results Snapshot (Consolidated) - Sep'25
Growth in half year ended Sep 2025 is 3.41% vs -6.04% in Sep 2024

Growth in half year ended Sep 2025 is 3.61% vs 51.02% in Sep 2024
Nine Monthly Results Snapshot (Consolidated) - Dec'25
YoY Growth in nine months ended Dec 2025 is 2.47% vs -7.99% in Dec 2024
YoY Growth in nine months ended Dec 2025 is -18.52% vs 35.52% in Dec 2024
Annual Results Snapshot (Consolidated) - Mar'26
YoY Growth in year ended Mar 2026 is 15.50% vs -10.25% in Mar 2025
YoY Growth in year ended Mar 2026 is -20.58% vs 33.55% in Mar 2025
About Sonal Mercantile Ltd

Company Coordinates


