
Compare Manali Petrochem with Similar Stocks
Dashboard
The company is Net-Debt Free
Poor long term growth as Operating profit has grown by an annual rate -29.40% of over the last 5 years
The company has declared Positive results for the last 4 consecutive quarters
With ROE of 5.3, it has a Attractive valuation with a 0.9 Price to Book Value
Despite the size of the company, domestic mutual funds hold only 0.02% of the company
Stock DNA
Petrochemicals
INR 1,127 Cr (Micro Cap)
16.00
15
0.75%
-0.37
5.33%
0.89
Total Returns (Price + Dividend) 
Latest dividend: 0.5 per share ex-dividend date: Sep-08-2025
Risk Adjusted Returns v/s
Returns Beta

News
Manali Petrochemicals Ltd is Rated Hold
Manali Petrochemicals Ltd is rated 'Hold' by MarketsMOJO, with this rating last updated on 03 June 2026. However, the analysis and financial metrics discussed here reflect the stock's current position as of 26 June 2026, providing investors with an up-to-date view of the company’s fundamentals, returns, and market standing.
Read full news article
Manali Petrochemicals Ltd is Rated Hold
Manali Petrochemicals Ltd is rated 'Hold' by MarketsMOJO, with this rating last updated on 03 June 2026. While the rating was revised on that date, the analysis and financial metrics discussed here reflect the company’s current position as of 15 June 2026, providing investors with the most up-to-date view of the stock’s fundamentals, returns, and market standing.
Read full news article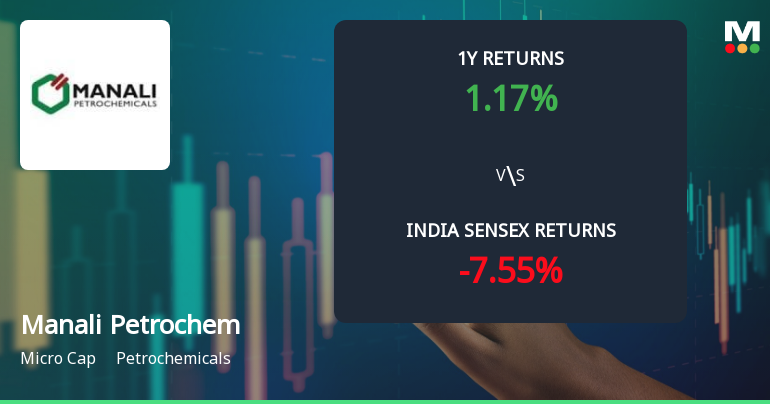
Manali Petrochemicals Ltd Shows Technical Momentum Shift Amid Mixed Market Signals
Manali Petrochemicals Ltd has experienced a notable shift in its technical momentum, moving from a sideways trend to a mildly bullish stance, supported by a blend of bullish and bearish signals across key technical indicators. The stock’s recent price surge of 9.90% to ₹64.96 on 15 Jun 2026 reflects renewed investor interest, although mixed signals from monthly and weekly charts suggest cautious optimism for this micro-cap petrochemical player.
Read full news article Announcements
Closure of Trading Window
23-Jun-2026 | Source : BSEAs stated in the Attachment.
Announcement Under Regulation 30 Of SEBI LODR
23-Jun-2026 | Source : BSEAs per the attached Letter.
Announcement Under Regulation 30 Of SEBI LODR
23-Jun-2026 | Source : BSEAs per the attached Letter.
Corporate Actions

No Upcoming Board Meetings

Manali Petrochemicals Ltd has declared 10% dividend, ex-date: 08 Sep 25

Manali Petrochemicals Ltd has announced 5:8 stock split, ex-date: 28 Sep 06

No Bonus history available

No Rights history available
Quality key factors
Valuation key factors
Technicals key factors
 Technical Indicator Scale: Bearish, Mildly Bearish, Sideways, Mildly Bullish, Bullish Turned
 Shareholding Snapshot : Mar 2026
Shareholding Compare (%holding)
Non Institution
None
Held by 4 Schemes (0.01%)
Held by 22 FIIs (0.37%)
Sidd Life Sciences Private Limited (38.28%)
Mercantile Ventures Limited (2.39%)
39.19%
Quarterly Results Snapshot (Consolidated) - Mar'26 - QoQ

QoQ Growth in quarter ended Mar 2026 is 18.48% vs -0.41% in Dec 2025

QoQ Growth in quarter ended Mar 2026 is -57.56% vs 277.02% in Dec 2025
Half Yearly Results Snapshot (Consolidated) - Sep'25
Growth in half year ended Sep 2025 is 2.56% vs -17.62% in Sep 2024
Growth in half year ended Sep 2025 is 145.76% vs -11.69% in Sep 2024
Nine Monthly Results Snapshot (Consolidated) - Dec'25
YoY Growth in nine months ended Dec 2025 is 9.44% vs -14.09% in Dec 2024
YoY Growth in nine months ended Dec 2025 is 445.81% vs 3.24% in Dec 2024
Annual Results Snapshot (Consolidated) - Mar'26
YoY Growth in year ended Mar 2026 is 13.96% vs -13.10% in Mar 2025
YoY Growth in year ended Mar 2026 is 343.36% vs 52.58% in Mar 2025
About Manali Petrochemicals Ltd

Company Coordinates


