
Compare Saptarishi Agro with Similar Stocks
Dashboard
Weak Long Term Fundamental Strength with a -250.65% CAGR growth in Operating Profits over the last 5 years
- Low ability to service debt as the company has a high Debt to EBITDA ratio of -5.00 times
Negative results in Mar 26
Risky - Negative EBITDA
Underperformed the market in the last 1 year
Stock DNA
Other Agricultural Products
INR 95 Cr (Micro Cap)
112.00
38
0.00%
3.47
8.25%
8.79
Total Returns (Price + Dividend) 
Saptarishi Agro for the last several years.
Risk Adjusted Returns v/s
Returns Beta

News
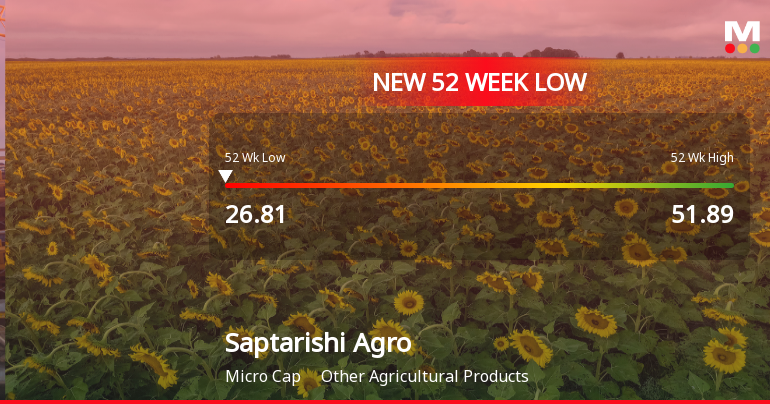
Saptarishi Agro Industries Ltd Falls to 52-Week Low of Rs 26.81 as Sell-Off Deepens
For the fourth consecutive session, Saptarishi Agro Industries Ltd has seen its share price decline, culminating in a fresh 52-week low of Rs 26.81 on 18 Jun 2026. This marks a 16.93% drop over the last four days, underscoring persistent selling pressure despite a broadly stable market backdrop.
Read full news article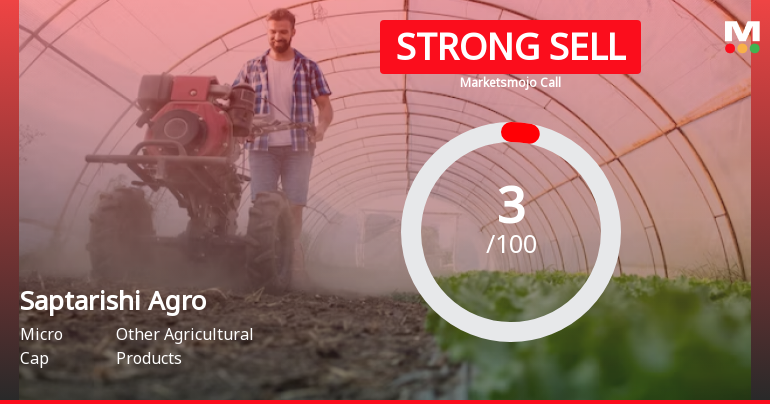
Saptarishi Agro Industries Ltd is Rated Strong Sell
Saptarishi Agro Industries Ltd is rated Strong Sell by MarketsMOJO, with this rating last updated on 02 April 2026. However, the analysis and financial metrics discussed here reflect the stock's current position as of 16 June 2026, providing investors with the latest insights into the company’s performance and outlook.
Read full news article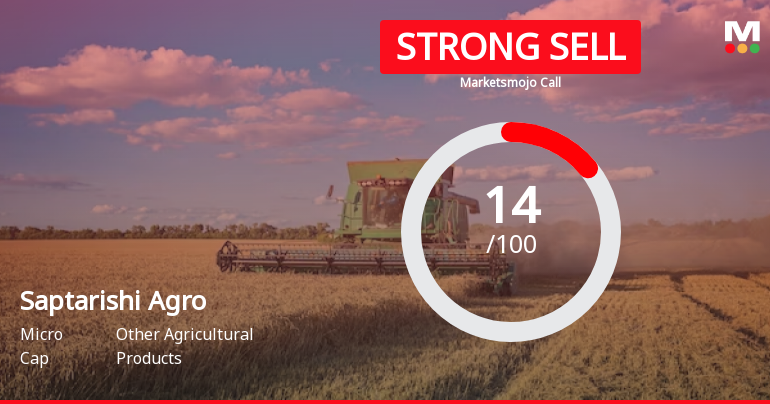
Saptarishi Agro Industries Ltd is Rated Strong Sell
Saptarishi Agro Industries Ltd is rated Strong Sell by MarketsMOJO, with this rating last updated on 02 Apr 2026. However, the analysis and financial metrics discussed here reflect the stock's current position as of 29 May 2026, providing investors with the latest insights into the company’s performance and outlook.
Read full news article Announcements
Compliances-Reg.24(A)-Annual Secretarial Compliance
27-May-2026 | Source : BSESubmission of Annual Secretarial Compliance Report year ended 31.03.2026
Announcement under Regulation 30 (LODR)-Newspaper Publication
26-May-2026 | Source : BSEPublication of financial results in Newspaper
Board Meeting Outcome for Regulation 30 And 33 Of The SEBI (Listing Obligations And Disclosure Requirements) Regulations 2015- Outcome Of Board Meeting- Dated 25Th May 2026 For Submission Of Audited Financial Results
25-May-2026 | Source : BSESubmission of Audited Financials
Corporate Actions

No Upcoming Board Meetings

No Dividend history available

No Splits history available

No Bonus history available

No Rights history available
Quality key factors
Valuation key factors
Technicals key factors
 Technical Indicator Scale: Bearish, Mildly Bearish, Sideways, Mildly Bullish, Bullish Turned
 Shareholding Snapshot : Mar 2026
Shareholding Compare (%holding)
Promoters
None
Held by 0 Schemes
Held by 0 FIIs
Calibre Rehabs Pvt Ltd (66.04%)
Dalsem Veciab Bv Agro Industries (2.06%)
21.49%
Quarterly Results Snapshot (Standalone) - Mar'26 - QoQ

QoQ Growth in quarter ended Mar 2026 is 100.40% vs -55.24% in Dec 2025
QoQ Growth in quarter ended Mar 2026 is 163.36% vs -246.37% in Dec 2025
Half Yearly Results Snapshot (Standalone) - Sep'25

Growth in half year ended Sep 2025 is 81.39% vs 131.57% in Sep 2024
Growth in half year ended Sep 2025 is 424.56% vs -435.29% in Sep 2024
Nine Monthly Results Snapshot (Standalone) - Dec'25
YoY Growth in nine months ended Dec 2025 is 57.49% vs 26.57% in Dec 2024
YoY Growth in nine months ended Dec 2025 is 23.76% vs -504.00% in Dec 2024
Annual Results Snapshot (Standalone) - Mar'26
YoY Growth in year ended Mar 2026 is -11.12% vs 92.84% in Mar 2025
YoY Growth in year ended Mar 2026 is -58.41% vs 4.90% in Mar 2025
About Saptarishi Agro Industries Ltd

Company Coordinates


