
Compare DCM Financial with Similar Stocks
Stock DNA
Non Banking Financial Company (NBFC)
INR 12 Cr (Micro Cap)
NA (Loss Making)
9
0.00%
-1.36
2.02%
-0.24
Total Returns (Price + Dividend) 
DCM Financial for the last several years.
Risk Adjusted Returns v/s
Returns Beta

News

Micro-Cap DCM Financial Services Ltd Locks at Upper Circuit — Rs 6.41 and Rising Delivery Tell the Story
At Rs 6.41, the buying was done — not because demand dried up, but because the exchange wouldn't let the stock go any higher. DCM Financial Services Ltd locked at its upper circuit of 4.75% on 1 Jun 2026, with buyers queuing and no sellers willing to part with shares.
Read full news article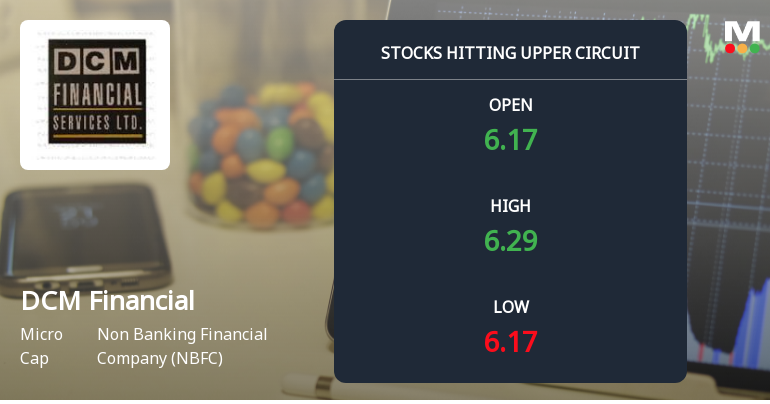
DCM Financial Services Ltd Locks at Upper Circuit With 4.85% Gain — Buyers Queue, Sellers Absent
At Rs 6.27, the buying was done — not because demand dried up, but because the exchange wouldn't let the stock go any higher. DCM Financial Services Ltd locked at its upper circuit of 4.85% on 1 Jun 2026, with buyers queuing and no sellers willing to part with shares.
Read full news article
DCM Financial Services Ltd Locks at Upper Circuit With 4.91% Gain — Buyers Queue, Sellers Absent
At Rs 5.98, the buying was done — not because demand dried up, but because the exchange wouldn't let the stock go any higher. DCM Financial Services Ltd locked at its upper circuit of 4.91% on 29 May 2026, with buyers queuing and no sellers willing to part with shares.
Read full news article Announcements
Announcement under Regulation 30 (LODR)-Newspaper Publication
20-May-2026 | Source : BSENewspaper Publication for Audited Financial Results for quarter and year ended March 31 2026
Board Meeting Outcome for Approval Of Audited Standalone & Consolidated Financial Results For Quarter And Year Ended March 31 2026
19-May-2026 | Source : BSEApproval of Audited Standalone & Consolidated Financial Results for quarter and year ended March 31 2026
Audited Standalone & Consolidated Financial Results For Quarter & Year Ended March 31 2026
19-May-2026 | Source : BSEAudited Standalone & Consolidated Financial Results for quarter and year ended March 31 2026
Corporate Actions

No Upcoming Board Meetings

No Dividend history available

No Splits history available

No Bonus history available

No Rights history available
Quality key factors
Valuation key factors
Technicals key factors
 Technical Indicator Scale: Bearish, Mildly Bearish, Sideways, Mildly Bullish, Bullish Turned
 Shareholding Snapshot : Mar 2026
Shareholding Compare (%holding)
Non Institution
None
Held by 7 Schemes (0.08%)
Held by 1 FIIs (0.0%)
Dcm Services Ltd (28.71%)
Punjab & Sind Bank (5.97%)
49.38%
Quarterly Results Snapshot (Consolidated) - Mar'26 - QoQ
QoQ Growth in quarter ended Mar 2026 is 0.00% vs 0.00% in Dec 2025

QoQ Growth in quarter ended Mar 2026 is 50.00% vs 31.58% in Dec 2025
Half Yearly Results Snapshot (Consolidated) - Sep'25
Growth in half year ended Sep 2025 is 0.00% vs 0.00% in Sep 2024

Growth in half year ended Sep 2025 is -392.31% vs 64.86% in Sep 2024
Nine Monthly Results Snapshot (Consolidated) - Dec'25
YoY Growth in nine months ended Dec 2025 is 0.00% vs 0.00% in Dec 2024
YoY Growth in nine months ended Dec 2025 is -143.24% vs 43.08% in Dec 2024
Annual Results Snapshot (Consolidated) - Mar'26
YoY Growth in year ended Mar 2026 is 0.00% vs 0.00% in Mar 2025
YoY Growth in year ended Mar 2026 is 14.29% vs -26.60% in Mar 2025
About DCM Financial Services Ltd

Company Coordinates


