
Compare Dr Agarwal's Eye with Similar Stocks
Dashboard
Healthy long term growth as Operating profit has grown by an annual rate 54.61%
The company has declared Positive results for the last 5 consecutive quarters
With ROCE of 17.3, it has a Fair valuation with a 4.7 Enterprise value to Capital Employed
29.26% of Promoter Shares are Pledged
Consistent Returns over the last 3 years
Total Returns (Price + Dividend) 
Latest dividend: 3.0041202458701495 per share ex-dividend date: Nov-07-2025
Risk Adjusted Returns v/s
Returns Beta

News
Dr Agarwals Eye Hospital Ltd is Rated Hold
Dr Agarwals Eye Hospital Ltd is rated 'Hold' by MarketsMOJO, with this rating last updated on 08 June 2026. While the rating change occurred on that date, the analysis and financial metrics discussed here reflect the stock's current position as of 01 July 2026, providing investors with the most up-to-date view of the company’s fundamentals and market performance.
Read full news article
Dr Agarwals Eye Hospital Ltd is Rated Hold
Dr Agarwals Eye Hospital Ltd is rated 'Hold' by MarketsMOJO, with this rating last updated on 8 June 2026. However, the analysis and financial metrics presented here reflect the stock's current position as of 20 June 2026, providing investors with an up-to-date view of its fundamentals, returns, and overall outlook.
Read full news article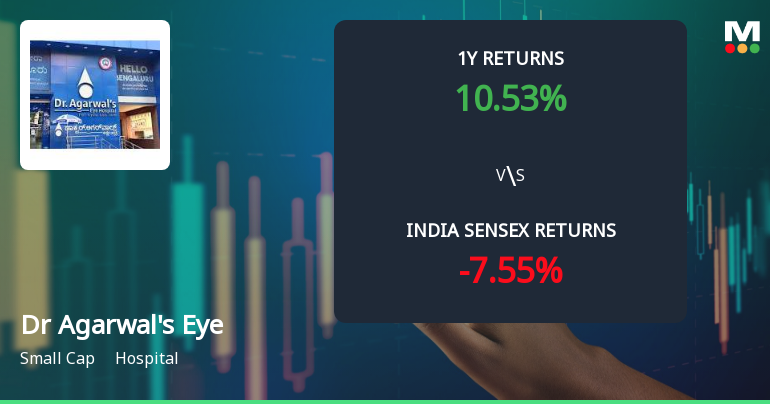
Dr Agarwals Eye Hospital Ltd Shows Technical Momentum Shift Amid Mixed Indicators
Dr Agarwals Eye Hospital Ltd has experienced a notable shift in its technical momentum, moving from a mildly bearish to a mildly bullish trend. This change is underscored by a complex interplay of technical indicators including MACD, RSI, moving averages, and volume-based metrics, signalling a cautious but positive outlook for the hospital sector small-cap stock.
Read full news article Announcements
Closure of Trading Window
20-Jun-2026 | Source : BSEDisclosure on Closure of Trading Window is submitted.
Announcement under Regulation 30 (LODR)-Credit Rating
16-Jun-2026 | Source : BSERe-affirmation and withdrawal of Credit Rating by CRISIL Ratings Limited with respect to the debt facilities availed by the Company is submitted.
Letter To Equity Shareholders And Creditors
01-Jun-2026 | Source : BSELetter providing direct weblink and a Static Quick Response Code to the Notice of the Equity Shareholders and Creditors dispatched by the Company is submitted.
Corporate Actions

No Upcoming Board Meetings

Dr Agarwals Eye Hospital Ltd has declared 30% dividend, ex-date: 07 Nov 25

No Splits history available

No Bonus history available

No Rights history available
Quality key factors
Valuation key factors
Technicals key factors
 Technical Indicator Scale: Bearish, Mildly Bearish, Sideways, Mildly Bullish, Bullish Turned
 Shareholding Snapshot : Mar 2026
Shareholding Compare (%holding)
Promoters
29.2618
Held by 3 Schemes (0.03%)
Held by 3 FIIs (2.2%)
Dr Agarwals Health Care Limited (72.67%)
Malabar India Fund Limited (2.14%)
17.93%
Quarterly Results Snapshot (Standalone) - Mar'26 - YoY

YoY Growth in quarter ended Mar 2026 is 20.21% vs 23.67% in Mar 2025
YoY Growth in quarter ended Mar 2026 is 1.56% vs 25.02% in Mar 2025
Half Yearly Results Snapshot (Standalone) - Sep'25
Growth in half year ended Sep 2025 is 16.04% vs 24.33% in Sep 2024

Growth in half year ended Sep 2025 is 29.44% vs 17.12% in Sep 2024
Nine Monthly Results Snapshot (Standalone) - Dec'25
YoY Growth in nine months ended Dec 2025 is 18.01% vs 24.62% in Dec 2024
YoY Growth in nine months ended Dec 2025 is 39.32% vs 15.16% in Dec 2024
Annual Results Snapshot (Standalone) - Mar'26
YoY Growth in year ended Mar 2026 is 18.56% vs 24.38% in Mar 2025
YoY Growth in year ended Mar 2026 is 28.27% vs 17.88% in Mar 2025
About Dr Agarwals Eye Hospital Ltd

Company Coordinates


