
Compare Inv.& Prec.Cast. with Similar Stocks
Dashboard
With a growth in Net Profit of 35.13%, the company declared Very Positive results in Mar 26
- The company has declared positive results for the last 3 consecutive quarters
- OPERATING PROFIT TO INTEREST(Q) Highest at 5.51 times
- ROCE(HY) Highest at 13.55%
- NET SALES(Q) Highest at Rs 51.17 cr
Market Beating performance in long term as well as near term
Stock DNA
Castings & Forgings
INR 852 Cr (Micro Cap)
69.00
49
0.06%
0.66
11.81%
8.10
Total Returns (Price + Dividend) 
Latest dividend: 0.5 per share ex-dividend date: Sep-11-2025
Risk Adjusted Returns v/s
Returns Beta

News
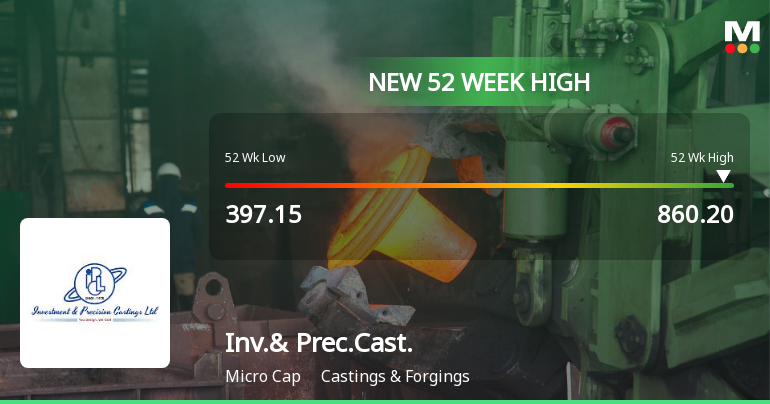
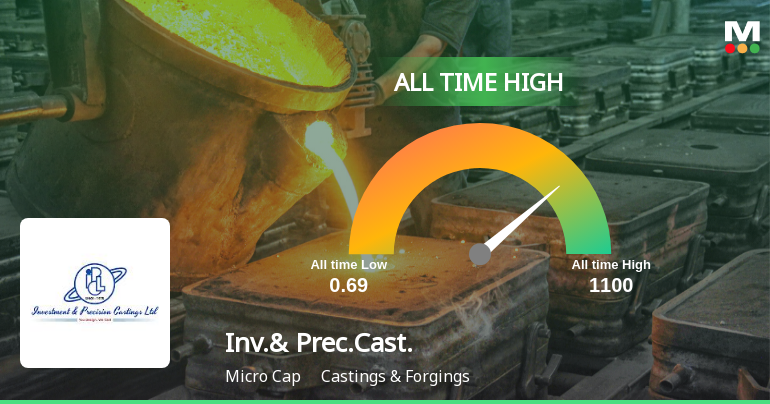
Broad-Based Technical Strength Lifts Investment & Precision Castings Ltd to 52-Week High of Rs 860.2
With a decisive break above Rs 860.2 on 2 Jul 2026, Investment & Precision Castings Ltd has reached a fresh 52-week high, marking a 57.78% gain over the past year and significantly outperforming the Sensex, which declined 7.19% in the same period. This milestone reflects a powerful confluence of technical momentum and improving fundamentals that have propelled the stock well beyond its 52-week low of Rs 397.15.
Read full news article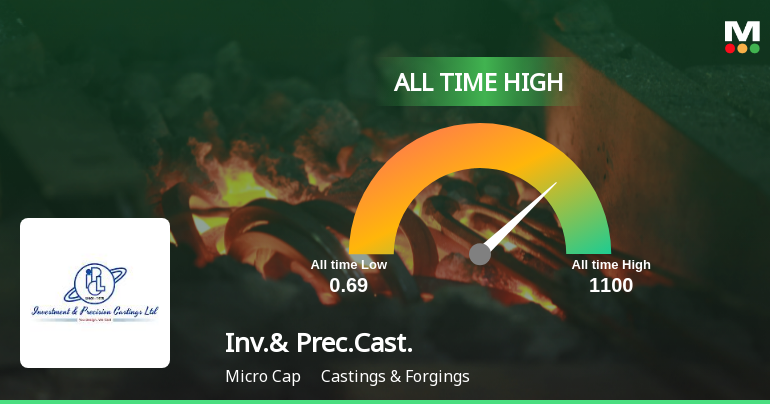
Announcements
Clarification On Price Moment
30-Jun-2026 | Source : BSEClarification Letter attached for Price Moment
Closure of Trading Window
29-Jun-2026 | Source : BSEclosing of Trading window for Quarter ended as on 30.06.2026
Clarification sought from Investment & Precision Castings Ltd
29-Jun-2026 | Source : BSEThe Exchange has sought clarification from Investment & Precision Castings Ltd on June 29 2026 with reference to significant movement in price in order to ensure that investors have latest relevant information about the company and to inform the market so that the interest of the investors is safeguarded.
The reply is awaited.
Corporate Actions

No Upcoming Board Meetings

Investment & Precision Castings Ltd has declared 5% dividend, ex-date: 11 Sep 25

No Splits history available

Investment & Precision Castings Ltd has announced 1:1 bonus issue, ex-date: 27 Jun 25

No Rights history available
Quality key factors
Valuation key factors
Technicals key factors
 Technical Indicator Scale: Bearish, Mildly Bearish, Sideways, Mildly Bullish, Bullish Turned
 Shareholding Snapshot : Mar 2026
Shareholding Compare (%holding)
Promoters
None
Held by 0 Schemes
Held by 0 FIIs
Meche Private Ltd (16.19%)
Rekha N Shah (10%)
40.39%
Quarterly Results Snapshot (Consolidated) - Mar'26 - QoQ

QoQ Growth in quarter ended Mar 2026 is 8.04% vs 5.17% in Dec 2025
QoQ Growth in quarter ended Mar 2026 is 35.13% vs -7.92% in Dec 2025
Half Yearly Results Snapshot (Consolidated) - Sep'25
Growth in half year ended Sep 2025 is 8.39% vs -8.94% in Sep 2024
Growth in half year ended Sep 2025 is 37.20% vs -34.54% in Sep 2024
Nine Monthly Results Snapshot (Consolidated) - Dec'25
YoY Growth in nine months ended Dec 2025 is 12.01% vs -6.60% in Dec 2024
YoY Growth in nine months ended Dec 2025 is 92.07% vs -41.41% in Dec 2024
Annual Results Snapshot (Consolidated) - Mar'26
YoY Growth in year ended Mar 2026 is 14.16% vs -3.44% in Mar 2025
YoY Growth in year ended Mar 2026 is 94.06% vs -22.21% in Mar 2025
About Investment & Precision Castings Ltd

Company Coordinates


