
Compare Hind.Construct. with Similar Stocks
Dashboard
Company's ability to service its debt is weak with a poor EBIT to Interest (avg) ratio of 0.87
- Company's ability to service its debt is weak with a poor EBIT to Interest (avg) ratio of 0.87
- The company has been able to generate a Return on Equity (avg) of 1.71% signifying low profitability per unit of shareholders funds
Poor long term growth as Net Sales has grown by an annual rate of -13.60% over the last 5 years
Negative results in Mar 26
With ROCE of 21.1, it has a Fair valuation with a 3 Enterprise value to Capital Employed
79.74% of Promoter Shares are Pledged
Total Returns (Price + Dividend) 
Latest dividend: 0.34447390391844873 per share ex-dividend date: May-30-2011
Risk Adjusted Returns v/s
Returns Beta

News
Hindustan Construction Company Ltd Sees Exceptional Volume Surge Amid Positive Momentum
Hindustan Construction Company Ltd (HCC) emerged as one of the most actively traded stocks on 24 June 2026, registering a remarkable surge in volume and price momentum. The construction sector heavyweight outperformed its peers and the broader market, signalling renewed investor interest and potential accumulation despite a recent downgrade reversal.
Read full news article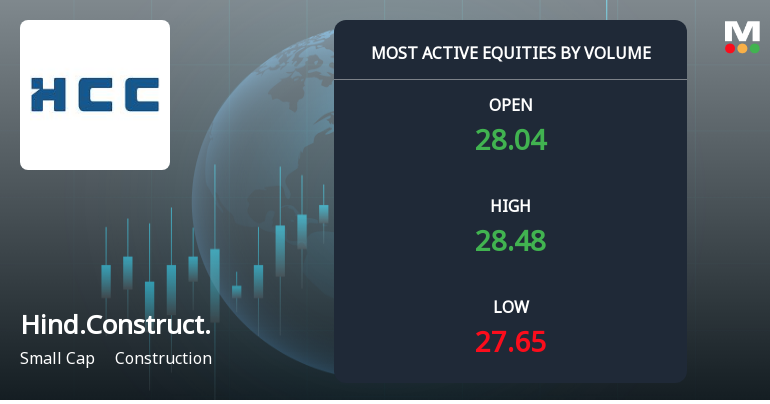
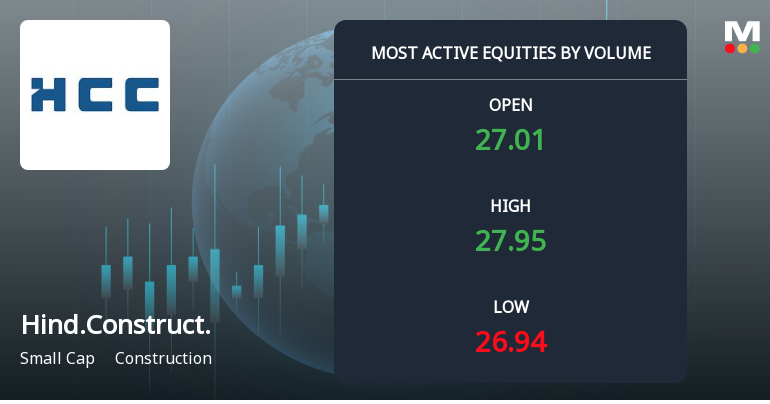
Hindustan Construction Company Ltd Sees Exceptional Volume Amid Mixed Price Action
Hindustan Construction Company Ltd (HCC), a prominent player in the construction sector, witnessed one of the highest trading volumes on 23 June 2026, with over 2.21 crore shares changing hands. Despite this surge in activity, the stock closed marginally lower, reflecting a complex interplay of market forces and investor sentiment.
Read full news article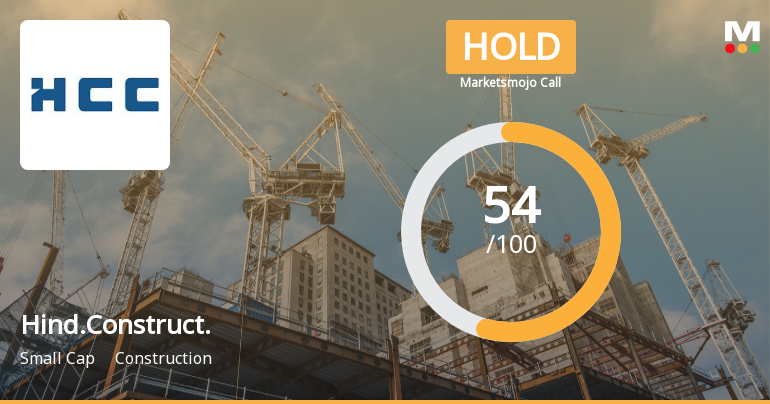
Hindustan Construction Company Ltd Upgraded to Hold on Technical and Valuation Improvements
Hindustan Construction Company Ltd (HCC) has seen its investment rating upgraded from Sell to Hold as of 22 June 2026, reflecting notable improvements in its technical indicators and a shift in valuation metrics. Despite recent quarterly financial setbacks, the company’s enhanced technical trend and fair valuation relative to peers have contributed to this revised outlook.
Read full news article Announcements
Announcement under Regulation 30 (LODR)-Press Release / Media Release
05-Jun-2026 | Source : BSEWe are attaching copy of the Press Release being issued by the Company.
Compliances-Reg.24(A)-Annual Secretarial Compliance
28-May-2026 | Source : BSEAnnual Secretarial Compliance Report for the financial year ended March 31 2026
Announcement under Regulation 30 (LODR)-Demise
22-May-2026 | Source : BSEIntimation regarding the demise of Director pursuant to Regulations 30 and 51 of SEBI (Listing Obligations and Disclosure Requirements) Regulations 2015
Corporate Actions

No Upcoming Board Meetings

Hindustan Construction Company Ltd has declared 40% dividend, ex-date: 30 May 11

No Splits history available

Hindustan Construction Company Ltd has announced 1:1 bonus issue, ex-date: 10 Aug 10

Hindustan Construction Company Ltd has announced 277:630 rights issue, ex-date: 05 Dec 25
Quality key factors
Valuation key factors
Technicals key factors
 Technical Indicator Scale: Bearish, Mildly Bearish, Sideways, Mildly Bullish, Bullish Turned
 Shareholding Snapshot : Mar 2026
Shareholding Compare (%holding)
Non Institution
79.7449
Held by 6 Schemes (0.26%)
Held by 96 FIIs (10.92%)
Hincon Holdings Ltd (8.26%)
Mukul Mahavir Agrawal (1.91%)
56.37%
Quarterly Results Snapshot (Consolidated) - Mar'26 - YoY

YoY Growth in quarter ended Mar 2026 is -27.77% vs -22.53% in Mar 2025

YoY Growth in quarter ended Mar 2026 is -34.57% vs -63.37% in Mar 2025
Half Yearly Results Snapshot (Consolidated) - Sep'25
Growth in half year ended Sep 2025 is -36.33% vs -14.27% in Sep 2024
Growth in half year ended Sep 2025 is 60.26% vs 23.09% in Sep 2024
Nine Monthly Results Snapshot (Consolidated) - Dec'25
YoY Growth in nine months ended Dec 2025 is -29.61% vs -19.18% in Dec 2024
YoY Growth in nine months ended Dec 2025 is 372.64% vs -90.29% in Dec 2024
Annual Results Snapshot (Consolidated) - Mar'26
YoY Growth in year ended Mar 2026 is -29.16% vs -20.03% in Mar 2025
YoY Growth in year ended Mar 2026 is 46.96% vs -76.45% in Mar 2025
About Hindustan Construction Company Ltd

Company Coordinates


