
Compare Triveni Turbine with Similar Stocks
Stock DNA
Heavy Electrical Equipment
INR 21,394 Cr (Small Cap)
63.00
38
0.59%
-0.38
24.97%
15.85
Total Returns (Price + Dividend) 
Latest dividend: 2.257859281437126 per share ex-dividend date: Feb-09-2026
Risk Adjusted Returns v/s
Returns Beta

News
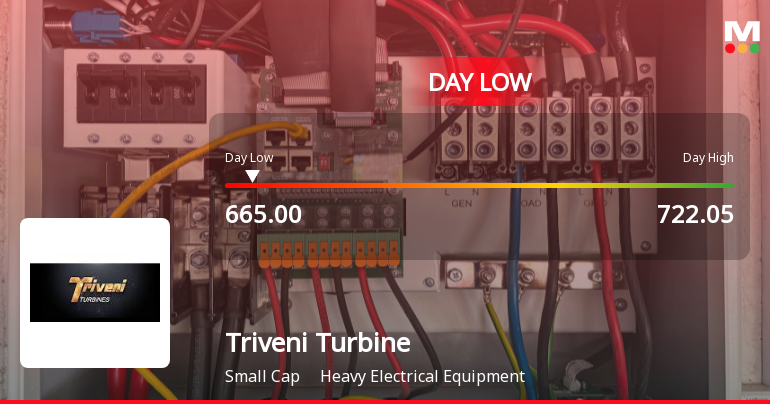
Triveni Turbine Ltd. Hits Intraday Low Amid Price Pressure on 24 Jun 2026
Triveni Turbine Ltd. experienced a notable decline today, touching an intraday low of Rs 665, reflecting a 7.49% drop as the stock faced significant price pressure despite broader market gains. The stock underperformed its sector and the Sensex, continuing a short-term downward trend amid mixed technical signals and market sentiment.
Read full news article
Triveni Turbine Ltd. Upgraded to Buy on Strong Technical and Fundamental Signals
Triveni Turbine Ltd., a prominent player in the Heavy Electrical Equipment sector, has seen its investment rating upgraded from Hold to Buy as of 22 June 2026. This upgrade reflects a comprehensive reassessment across four critical parameters: Quality, Valuation, Financial Trend, and Technicals. The company’s robust long-term fundamentals, improved technical indicators, and market-beating returns have collectively driven this positive revision.
Read full news article
Triveni Turbine Ltd. Technical Momentum Shifts Signal Bullish Outlook
Triveni Turbine Ltd., a small-cap player in the Heavy Electrical Equipment sector, has witnessed a significant shift in its technical momentum, upgrading its outlook from mildly bullish to bullish. With a strong 9.97% gain on 23 June 2026 and a MarketsMOJO Mojo Score rising to 72.0, the stock’s technical indicators now align favourably, signalling potential upside for investors amid robust price action and improving trend dynamics.
Read full news article Announcements
Announcement under Regulation 30 (LODR)-Analyst / Investor Meet - Intimation
01-Jun-2026 | Source : BSESchedule of Investor/ analyst Conference
Compliances-Reg.24(A)-Annual Secretarial Compliance
22-May-2026 | Source : BSEAnnual Secretarial Compliance report of the Company for the financial year ended on March 31 2026.
Announcement under Regulation 30 (LODR)-Earnings Call Transcript
22-May-2026 | Source : BSETranscript of the Earnings Conference Call held on May 19 2026
Corporate Actions

No Upcoming Board Meetings

Triveni Turbine Ltd. has declared 225% dividend, ex-date: 09 Feb 26

No Splits history available

No Bonus history available

No Rights history available
Quality key factors
Valuation key factors
Technicals key factors
 Technical Indicator Scale: Bearish, Mildly Bearish, Sideways, Mildly Bullish, Bullish Turned
 Shareholding Snapshot : Mar 2026
Shareholding Compare (%holding)
Promoters
None
Held by 26 Schemes (15.27%)
Held by 166 FIIs (20.81%)
Subhadra Trade And Finance Limited (27.28%)
Icici Prudential Energy Opportunities Fund (5.45%)
5.67%
Quarterly Results Snapshot (Consolidated) - Mar'26 - QoQ

QoQ Growth in quarter ended Mar 2026 is 8.91% vs 23.27% in Dec 2025

QoQ Growth in quarter ended Mar 2026 is 10.64% vs 0.99% in Dec 2025
Half Yearly Results Snapshot (Consolidated) - Sep'25
Growth in half year ended Sep 2025 is -9.01% vs 26.20% in Sep 2024
Growth in half year ended Sep 2025 is -8.89% vs 36.72% in Sep 2024
Nine Monthly Results Snapshot (Consolidated) - Dec'25
YoY Growth in nine months ended Dec 2025 is 2.30% vs 22.74% in Dec 2024
YoY Growth in nine months ended Dec 2025 is -5.89% vs 36.28% in Dec 2024
Annual Results Snapshot (Consolidated) - Mar'26
YoY Growth in year ended Mar 2026 is 8.74% vs 21.27% in Mar 2025
YoY Growth in year ended Mar 2026 is -2.10% vs 32.69% in Mar 2025
About Triveni Turbine Ltd.

Company Coordinates


