
Compare Unison Metals with Similar Stocks
Dashboard
Weak Long Term Fundamental Strength with an average Return on Capital Employed (ROCE) of 9.98%
- Poor long term growth as Operating profit has grown by an annual rate 15.72% of over the last 5 years
- Low ability to service debt as the company has a high Debt to EBITDA ratio of 3.95 times
Flat results in Mar 26
Falling Participation by Institutional Investors
Consistent Underperformance against the benchmark over the last 3 years
Stock DNA
Iron & Steel Products
INR 20 Cr (Micro Cap)
3.00
26
0.00%
0.95
9.31%
0.27
Total Returns (Price + Dividend) 
Unison Metals for the last several years.
Risk Adjusted Returns v/s
Returns Beta

News
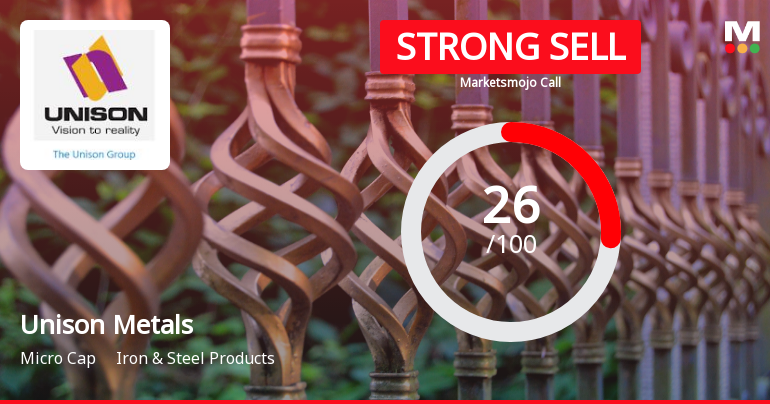
Unison Metals Ltd Downgraded to Strong Sell Amid Weak Fundamentals and Bearish Technicals
Unison Metals Ltd, a micro-cap player in the Iron & Steel Products sector, has been downgraded from a Sell to a Strong Sell rating as of 13 July 2026. This revision reflects deteriorating technical indicators, stagnant financial performance, and persistent underperformance against market benchmarks, signalling heightened risks for investors.
Read full news article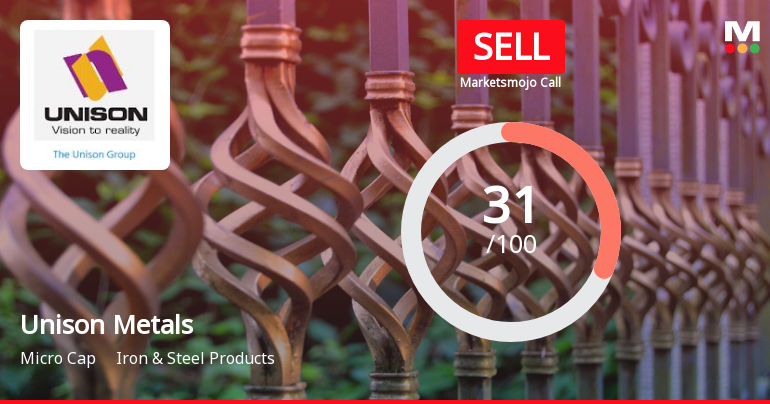
Unison Metals Ltd Upgraded to Sell on Technical Improvements Despite Weak Fundamentals
Unison Metals Ltd, a micro-cap player in the Iron & Steel Products sector, has seen its investment rating upgraded from Strong Sell to Sell as of 8 July 2026. This change is primarily driven by a shift in technical indicators, even as the company continues to grapple with weak financial trends and long-term fundamental challenges. The nuanced upgrade reflects a complex interplay between valuation attractiveness, technical signals, and persistent operational headwinds.
Read full news article
Unison Metals Ltd Downgraded to Strong Sell Amid Weak Fundamentals and Bearish Technicals
Unison Metals Ltd, a micro-cap player in the Iron & Steel Products sector, has seen its investment rating downgraded from Sell to Strong Sell as of 24 June 2026. This revision reflects deteriorating technical indicators, stagnant financial performance, and a challenging valuation backdrop, signalling heightened risks for investors amid sustained underperformance relative to the broader market.
Read full news article Announcements
Closure of Trading Window
30-Jun-2026 | Source : BSEPursuant to the provision of the Regulation 9 (1) of the Sebi(PIT) Regulations 2015 and in compliance with the term of the code of conduct to regulate monitor and report trading by designated persons we wish to inform you that the trading window for dealing in securities of the companiy shall remain closed for all directors officers and designated persons and thier immediate relatives from 01st July 2026 till 48 hrs after the declaration of financial results for the quater ended 30th June 2026. Accordingly all designated persons and their immediate relatives of the company have been advised not to trade in the securities of the company during the above mentioned period of closure of Trading Window.
Announcement under Regulation 30 (LODR)-Newspaper Publication
02-Jun-2026 | Source : BSESubmission of Newspaper Advertisement under Regulation 47 of SEBI (LODR) Regulation 2015 for Enclosing Financial Results for Quarter and Year ended as on 31st March 2026.
Compliances-Reg.24(A)-Annual Secretarial Compliance
30-May-2026 | Source : BSEWith reference to above captioned subject please find enclosed herewith Annual Secretarial Compliance Report for the year ended 31 March 2026 as required under Regulation 24A of SEBI(LODR) Regulations 2015
Corporate Actions

No Upcoming Board Meetings

No Dividend history available

Unison Metals Ltd has announced 1:10 stock split, ex-date: 28 Nov 25

Unison Metals Ltd has announced 4:1 bonus issue, ex-date: 07 Oct 21

Unison Metals Ltd has announced 6:7 rights issue, ex-date: 16 May 25
Quality key factors
Valuation key factors
Technicals key factors
 Technical Indicator Scale: Bearish, Mildly Bearish, Sideways, Mildly Bullish, Bullish Turned
 Shareholding Snapshot : Mar 2026
Shareholding Compare (%holding)
Non Institution
None
Held by 0 Schemes
Held by 0 FIIs
Shelja Finlease Pvt Ltd (8.22%)
Natvarsinh T Chavda . (4.91%)
59.4%
Quarterly Results Snapshot (Consolidated) - Mar'26 - QoQ

QoQ Growth in quarter ended Mar 2026 is -46.04% vs 50.89% in Dec 2025
QoQ Growth in quarter ended Mar 2026 is -83.02% vs 228.24% in Dec 2025
Half Yearly Results Snapshot (Consolidated) - Sep'25

Growth in half year ended Sep 2025 is 100.96% vs 6.43% in Sep 2024
Growth in half year ended Sep 2025 is 26.11% vs 129.22% in Sep 2024
Nine Monthly Results Snapshot (Consolidated) - Dec'25
YoY Growth in nine months ended Dec 2025 is 111.82% vs 14.88% in Dec 2024
YoY Growth in nine months ended Dec 2025 is 201.38% vs 134.71% in Dec 2024
Annual Results Snapshot (Consolidated) - Mar'26
YoY Growth in year ended Mar 2026 is 58.18% vs 14.32% in Mar 2025
YoY Growth in year ended Mar 2026 is 63.68% vs 25.28% in Mar 2025
About Unison Metals Ltd

Company Coordinates


