
Compare Tiger Logistics with Similar Stocks
Stock DNA
Transport Services
INR 371 Cr (Micro Cap)
17.00
36
0.00%
0.06
13.43%
2.31
Total Returns (Price + Dividend) 
Latest dividend: 0.10022151898734177 per share ex-dividend date: Dec-01-2021
Risk Adjusted Returns v/s
Returns Beta

News
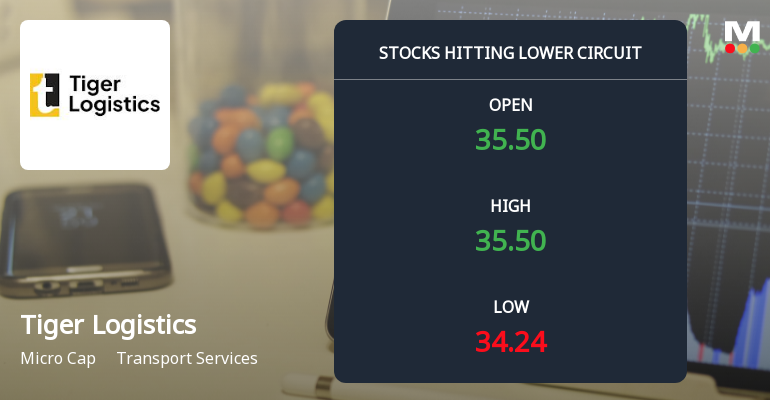
Tiger Logistics (India) Ltd Locks at Lower Circuit With 3.3% Loss — Sellers Queue, No Buyers in Sight
At Rs 34.59, Tiger Logistics (India) Ltd locked at its lower circuit on 11 Jun 2026, falling 3.3% within a 5% price band. Sellers were lined up to exit, but no buyers emerged to absorb the supply, resulting in a frozen price and unfilled sell orders.
Read full news article
Tiger Logistics (India) Ltd is Rated Sell
Tiger Logistics (India) Ltd is rated Sell by MarketsMOJO. This rating was last updated on 14 Nov 2025, reflecting a shift from a previous Hold stance. However, the analysis and financial metrics discussed here represent the stock’s current position as of 10 June 2026, providing investors with an up-to-date view of its performance and outlook.
Read full news article
Tiger Logistics (India) Ltd is Rated Sell
Tiger Logistics (India) Ltd is rated Sell by MarketsMOJO, with this rating last updated on 14 Nov 2025. However, the analysis and financial metrics discussed here reflect the company’s current position as of 27 May 2026, providing investors with an up-to-date view of the stock’s fundamentals, returns, and technical outlook.
Read full news article Announcements
Announcement under Regulation 30 (LODR)-Press Release / Media Release
05-Jun-2026 | Source : BSEPress Release dated 5th June 2026.
Announcement under Regulation 30 (LODR)-Credit Rating
05-Jun-2026 | Source : BSEIntimation of Revision in Credit Rating
Compliances-Reg.24(A)-Annual Secretarial Compliance
29-May-2026 | Source : BSEAnnual Secretarial Compliance Report for the year ended 31st March 2026.
Corporate Actions

No Upcoming Board Meetings

Tiger Logistics (India) Ltd has declared 10% dividend, ex-date: 01 Dec 21

Tiger Logistics (India) Ltd has announced 1:10 stock split, ex-date: 04 Mar 24

Tiger Logistics (India) Ltd has announced 3:2 bonus issue, ex-date: 15 Oct 15

No Rights history available
Quality key factors
Valuation key factors
Technicals key factors
 Technical Indicator Scale: Bearish, Mildly Bearish, Sideways, Mildly Bullish, Bullish Turned
 Shareholding Snapshot : Mar 2026
Shareholding Compare (%holding)
Promoters
None
Held by 0 Schemes
Held by 14 FIIs (11.48%)
Brahma Suppliers Private Limited (33.07%)
Multitude Growth Funds Limited (3.97%)
21.16%
Quarterly Results Snapshot (Standalone) - Mar'26 - YoY

YoY Growth in quarter ended Mar 2026 is 41.97% vs 23.50% in Mar 2025

YoY Growth in quarter ended Mar 2026 is -65.53% vs 59.80% in Mar 2025
Half Yearly Results Snapshot (Standalone) - Sep'25
Growth in half year ended Sep 2025 is 3.80% vs 173.36% in Sep 2024
Growth in half year ended Sep 2025 is 9.62% vs 128.14% in Sep 2024
Nine Monthly Results Snapshot (Standalone) - Dec'25
YoY Growth in nine months ended Dec 2025 is -2.73% vs 185.87% in Dec 2024
YoY Growth in nine months ended Dec 2025 is -6.37% vs 128.41% in Dec 2024
Annual Results Snapshot (Standalone) - Mar'26
YoY Growth in year ended Mar 2026 is 6.81% vs 123.22% in Mar 2025
YoY Growth in year ended Mar 2026 is -20.33% vs 108.41% in Mar 2025
About Tiger Logistics (India) Ltd

Company Coordinates


