
Compare Anant Raj with Similar Stocks
Dashboard
Poor Management Efficiency with a low ROCE of 7.20%
- The company has been able to generate a Return on Capital Employed (avg) of 7.20% signifying low profitability per unit of total capital (equity and debt)
With ROE of 9.6, it has a Very Expensive valuation with a 3.2 Price to Book Value
Falling Participation by Institutional Investors
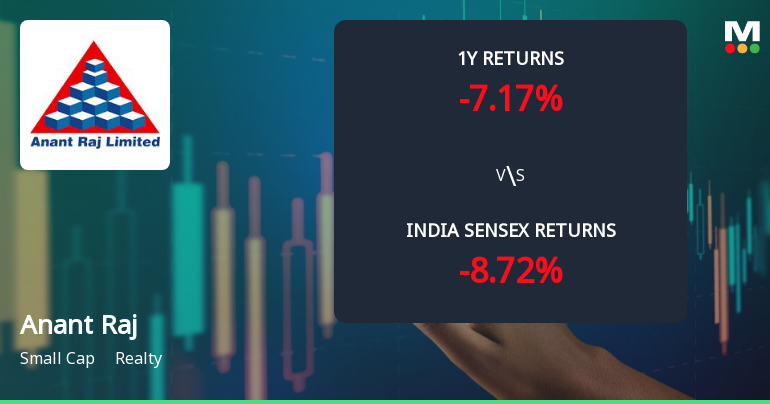
Total Returns (Price + Dividend) 
Latest dividend: 0.72 per share ex-dividend date: Jul-16-2025
Risk Adjusted Returns v/s
Returns Beta

News
Anant Raj Ltd Technical Momentum Shifts Amid Mixed Market Signals
Anant Raj Ltd, a small-cap player in the realty sector, has experienced a notable shift in its technical momentum, moving from a sideways trend to a mildly bearish stance. Despite some bullish weekly indicators, monthly signals suggest caution, reflecting a complex interplay of market forces and investor sentiment as the stock trades at ₹514.30, down 1.57% on 30 Jun 2026.
Read full news article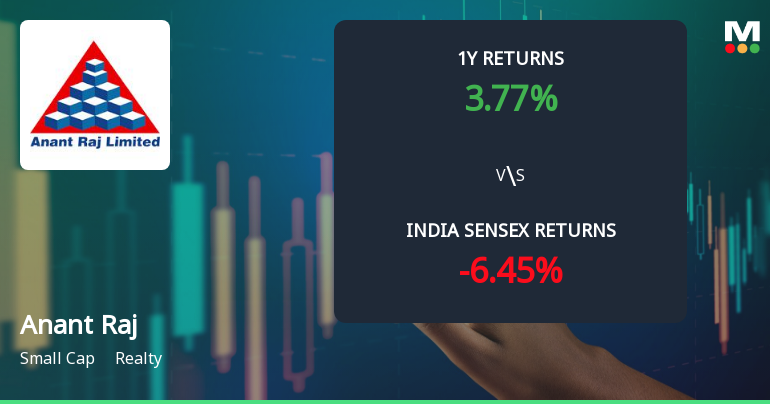
Anant Raj Ltd Technical Momentum Shifts Amid Mixed Market Signals
Anant Raj Ltd, a small-cap player in the realty sector, has experienced a notable shift in its technical momentum, moving from a mildly bearish stance to a sideways trend. Despite a recent upgrade in price, the stock faces a complex interplay of technical indicators, reflecting a cautious outlook amid mixed signals from MACD, RSI, moving averages, and other momentum oscillators.
Read full news article
Anant Raj Ltd is Rated Sell by MarketsMOJO
Anant Raj Ltd is rated 'Sell' by MarketsMOJO, with this rating last updated on 09 June 2026. However, the analysis and financial metrics discussed here reflect the stock's current position as of 21 June 2026, providing investors with an up-to-date view of the company’s fundamentals, valuation, financial trends, and technical outlook.
Read full news article Announcements
Corporate Action-Record Date For Determining Entitlement Of Members To Receive Dividend For The Financial Year Ended March 31 2026
27-Jun-2026 | Source : BSEFixation of Record date
Board Meeting Outcome for Disclosures Under Regulation 30 Of Listing Regulations
27-Jun-2026 | Source : BSEOutcome of Board Meeting held on June 27 2026.
Announcement under Regulation 30 (LODR)-Newspaper Publication
20-Jun-2026 | Source : BSENewspaper Publication
Corporate Actions

No Upcoming Board Meetings

Anant Raj Ltd has declared 36% dividend, ex-date: 16 Jul 25

Anant Raj Ltd has announced 2:10 stock split, ex-date: 08 Oct 07

No Bonus history available

No Rights history available
Quality key factors
Valuation key factors
Technicals key factors
 Technical Indicator Scale: Bearish, Mildly Bearish, Sideways, Mildly Bullish, Bullish Turned
 Shareholding Snapshot : Mar 2026
Shareholding Compare (%holding)
Promoters
None
Held by 21 Schemes (3.23%)
Held by 154 FIIs (10.88%)
Roma Sarin (14.11%)
Genesis Grand General Trading L.l.c (2.54%)
19.43%
Quarterly Results Snapshot (Consolidated) - Mar'26 - YoY

YoY Growth in quarter ended Mar 2026 is 19.64% vs 22.16% in Mar 2025
YoY Growth in quarter ended Mar 2026 is 23.57% vs 51.46% in Mar 2025
Half Yearly Results Snapshot (Consolidated) - Sep'25
Growth in half year ended Sep 2025 is 24.22% vs 51.85% in Sep 2024
Growth in half year ended Sep 2025 is 34.30% vs 77.50% in Sep 2024
Nine Monthly Results Snapshot (Consolidated) - Dec'25
YoY Growth in nine months ended Dec 2025 is 22.74% vs 45.99% in Dec 2024
YoY Growth in nine months ended Dec 2025 is 33.02% vs 68.09% in Dec 2024
Annual Results Snapshot (Consolidated) - Mar'26
YoY Growth in year ended Mar 2026 is 21.92% vs 38.88% in Mar 2025
YoY Growth in year ended Mar 2026 is 30.39% vs 63.10% in Mar 2025
About Anant Raj Ltd

Company Coordinates


