
Compare Anupam Finserv with Similar Stocks
Stock DNA
Non Banking Financial Company (NBFC)
INR 38 Cr (Micro Cap)
20.00
21
0.00%
0.30
6.41%
1.22
Total Returns (Price + Dividend) 
Anupam Finserv for the last several years.
Risk Adjusted Returns v/s
Returns Beta

News

Anupam Finserv Ltd Rating Upgraded to Sell Amid Mixed Financial and Technical Signals
Anupam Finserv Ltd, a micro-cap player in the Non Banking Financial Company (NBFC) sector, has seen its investment rating upgraded from Strong Sell to Sell as of 15 June 2026. This change reflects a nuanced shift in the company’s technical outlook despite persistent challenges in its fundamental and financial performance. The upgrade is primarily driven by improvements in technical indicators, while valuation and financial trends continue to present a mixed picture for investors.
Read full news article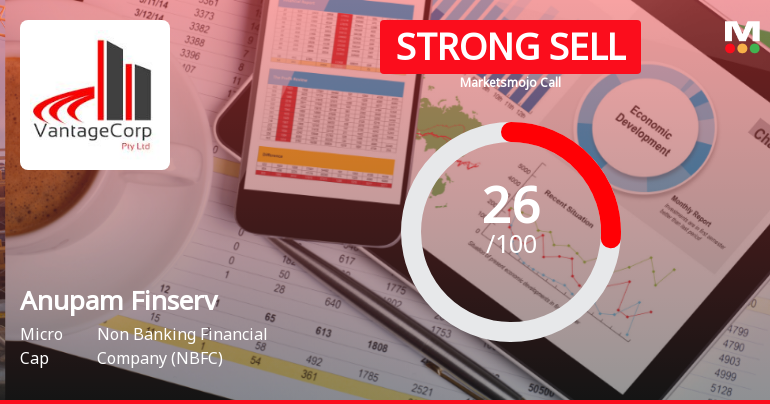
Anupam Finserv Ltd Downgraded to Strong Sell Amid Weak Fundamentals and Bearish Technicals
Anupam Finserv Ltd, a micro-cap player in the Non Banking Financial Company (NBFC) sector, has been downgraded from a Sell to a Strong Sell rating by MarketsMOJO as of 10 June 2026. This revision reflects deteriorating technical indicators, stagnant financial performance, and weak long-term fundamentals, signalling heightened caution for investors amid ongoing market pressures.
Read full news article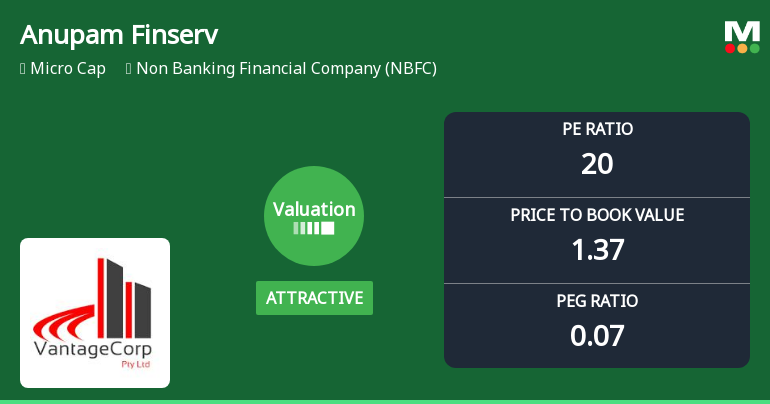
Anupam Finserv Ltd Valuation Shifts Signal Renewed Price Attractiveness
Anupam Finserv Ltd, a micro-cap player in the Non Banking Financial Company (NBFC) sector, has seen a notable shift in its valuation parameters, moving from fair to attractive territory. Despite a recent downgrade in its Mojo Grade to Strong Sell, the company’s price-to-earnings (P/E) and price-to-book value (P/BV) ratios suggest a potential value opportunity for discerning investors amid a challenging NBFC landscape.
Read full news article Announcements
Announcement under Regulation 30 (LODR)-Newspaper Publication
01-Jun-2026 | Source : BSEPlease find attached newspaper publication for financial results for quarter and year ended 31st March 2026
Board Meeting Outcome for Outcome Of Board Meeting
29-May-2026 | Source : BSEThis is to inform you that the Board of Directors of the Company at its Meeting held on 29th May 2026 has inter alia approved the following: 1. Audited Standalone Financial Results of the Company for the quarter and year ended 31st March 2026; 2. Issue of Secured Unlisted Unrated Redeemable Fully Paid Non-Convertible Debentures upto to Rs. 20 Crores (Rupees Twenty Crores only) to the eligible investors on a private placement basis in one or more tranches. 3. Approval of Material Related Party Transactions. 4. Grant of Employee Stock Options (ESOPs) The Meeting of the Board of Directors of the Company commenced on 29th May 2026 at 01:00 p.m. and concluded at 03.00 p.m.
Announcement under Regulation 30 (LODR)-Allotment of ESOP / ESPS
29-May-2026 | Source : BSEThe NRC Committee has in their meeting approved grant of ESOP as per details enclosed
Corporate Actions

No Upcoming Board Meetings

No Dividend history available

Anupam Finserv Ltd has announced 1:10 stock split, ex-date: 06 Oct 21

Anupam Finserv Ltd has announced 1:10 bonus issue, ex-date: 17 Feb 22

Anupam Finserv Ltd has announced 1:1 rights issue, ex-date: 27 Dec 24
Quality key factors
Valuation key factors
Technicals key factors
 Technical Indicator Scale: Bearish, Mildly Bearish, Sideways, Mildly Bullish, Bullish Turned
 Shareholding Snapshot : Mar 2026
Shareholding Compare (%holding)
Promoters
None
Held by 0 Schemes
Held by 0 FIIs
Pravin Nanji Gala (21.75%)
Manilal Bhuralal Gala (1.95%)
45.45%
Quarterly Results Snapshot (Standalone) - Mar'26 - YoY

YoY Growth in quarter ended Mar 2026 is 48.86% vs 12.82% in Mar 2025
YoY Growth in quarter ended Mar 2026 is 1,450.00% vs -90.48% in Mar 2025
Half Yearly Results Snapshot (Standalone) - Sep'25
Growth in half year ended Sep 2025 is 53.68% vs 25.83% in Sep 2024
Growth in half year ended Sep 2025 is 217.95% vs 8.33% in Sep 2024
Nine Monthly Results Snapshot (Standalone) - Dec'25
YoY Growth in nine months ended Dec 2025 is 41.84% vs 22.50% in Dec 2024
YoY Growth in nine months ended Dec 2025 is 203.70% vs -30.77% in Dec 2024
Annual Results Snapshot (Standalone) - Mar'26
YoY Growth in year ended Mar 2026 is 43.94% vs 17.03% in Mar 2025
YoY Growth in year ended Mar 2026 is 282.35% vs -45.74% in Mar 2025
About Anupam Finserv Ltd

Company Coordinates


