
Compare Lime Chemicals with Similar Stocks
Dashboard
With a Operating Losses, the company has a Weak Long Term Fundamental Strength
- Poor long term growth as Net Sales has grown by an annual rate of -20.32% over the last 5 years
- High Debt Company with a Debt to Equity ratio (avg) of 2.56 times
Flat results in Mar 26
Risky - Negative EBITDA
Falling Participation by Institutional Investors
Stock DNA
Commodity Chemicals
INR 10 Cr (Micro Cap)
NA (Loss Making)
46
0.00%
2.47
-10.06%
5.43
Total Returns (Price + Dividend) 
Latest dividend: 0.9700 per share ex-dividend date: Sep-25-2006
Risk Adjusted Returns v/s
Returns Beta

News
Lime Chemicals Ltd Upgraded to Sell on Technical Improvement Despite Weak Fundamentals
Lime Chemicals Ltd has seen its investment rating downgraded from Strong Sell to Sell as of 10 June 2026, reflecting a complex interplay of technical improvements offset by deteriorating fundamental and valuation metrics. Despite a mild technical uptrend, the company’s weak financial performance, high leverage, and poor long-term growth prospects continue to weigh heavily on investor sentiment.
Read full news articleAre Lime Chemicals Ltd latest results good or bad?
Lime Chemicals Ltd's latest financial results for Q4 FY26 present a complex picture of operational performance. The company reported net sales of ₹2.28 crores, reflecting a year-on-year growth of 39.02% compared to the same quarter last year. This growth is notable, especially when considering the previous quarter's performance, which also showed a sequential increase of 49.02%. However, despite this revenue growth, the company faced challenges in achieving sustainable profitability, as evidenced by a net profit of just ₹0.03 crores, which is a marginal improvement from a loss of ₹0.08 crores in the prior quarter. The operating margin for Q4 FY26 stood at -1.75%, indicating that core business operations remain in loss-making territory, although this represents a slight improvement from the previous quarter's -5.88%. The profit after tax (PAT) margin showed a positive shift to 1.32%, up from -5.23% in Q3 FY...
Read full news article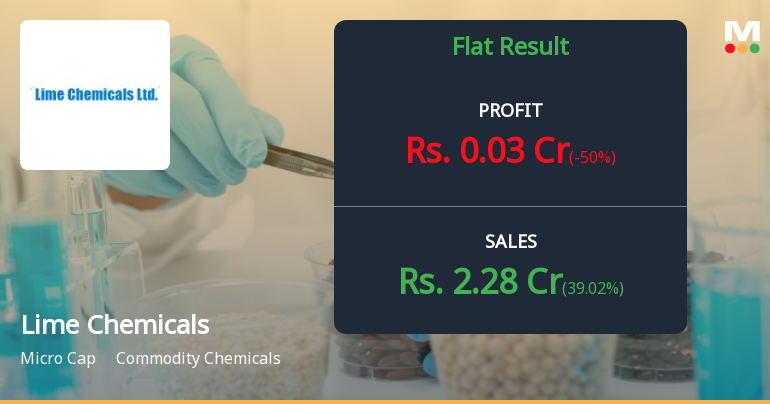
Lime Chemicals Q4 FY26: Losses Narrow but Operational Struggles Persist
Lime Chemicals Limited, a Maharashtra-based calcium carbonate manufacturer, reported a marginal quarterly profit of ₹0.03 crores in Q4 FY26, marking a significant turnaround from the ₹0.08 crore loss posted in Q3 FY26. However, the micro-cap company with a market capitalisation of just ₹9.39 crores continues to grapple with persistent operational challenges, negative operating margins, and a structurally weak balance sheet that has kept investors at bay.
Read full news article Announcements
Closure of Trading Window
29-Jun-2026 | Source : BSETrading Window for dealing in Companys shares for the Designated Persons shall be closed from 01st July 2026 till 48 hours of approval of unaudited financial results for the quarter ending on 30th June 2026.
Audited Quarterly And Yearly Financial Results For The Quarter And Year Ended On 31St March 2026
30-May-2026 | Source : BSEAudited financial results for the quarter and year ended on 31st March 2026 is attached herewith.
Board Meeting Outcome for Outcome Of Board Meeting Held On 30Th May 2026
30-May-2026 | Source : BSEOutcome of the Board Meeting held on 30th May 2026 is attached herewith.
Corporate Actions

No Upcoming Board Meetings

Lime Chemicals Ltd has declared 12% dividend, ex-date: 25 Sep 06

No Splits history available

No Bonus history available

No Rights history available
Quality key factors
Valuation key factors
Technicals key factors
 Technical Indicator Scale: Bearish, Mildly Bearish, Sideways, Mildly Bullish, Bullish Turned
 Shareholding Snapshot : Mar 2026
Shareholding Compare (%holding)
Non Institution
None
Held by 5 Schemes (0.05%)
Held by 0 FIIs
Rahim Ahmed Dawoodani (10.62%)
Devanshi Parimal Merchant (12.3%)
66.3%
Quarterly Results Snapshot (Standalone) - Mar'26 - YoY

YoY Growth in quarter ended Mar 2026 is 39.02% vs -30.51% in Mar 2025

YoY Growth in quarter ended Mar 2026 is -50.00% vs 154.55% in Mar 2025
Half Yearly Results Snapshot (Standalone) - Sep'25
Growth in half year ended Sep 2025 is -38.93% vs -1.45% in Sep 2024
Growth in half year ended Sep 2025 is -230.00% vs 131.25% in Sep 2024
Nine Monthly Results Snapshot (Standalone) - Dec'25
YoY Growth in nine months ended Dec 2025 is -39.65% vs -0.87% in Dec 2024
YoY Growth in nine months ended Dec 2025 is -231.25% vs 142.11% in Dec 2024
Annual Results Snapshot (Standalone) - Mar'26
YoY Growth in year ended Mar 2026 is -26.37% vs -7.46% in Mar 2025
YoY Growth in year ended Mar 2026 is -177.27% vs 144.90% in Mar 2025
About Lime Chemicals Ltd

Company Coordinates


