
Compare Hexa Tradex with Similar Stocks
Dashboard
Poor long term growth as Operating profit has grown by an annual rate -186.30% of over the last 5 years
Flat results in Mar 26
Risky - Negative EBITDA
Despite the size of the company, domestic mutual funds hold only 0.1% of the company
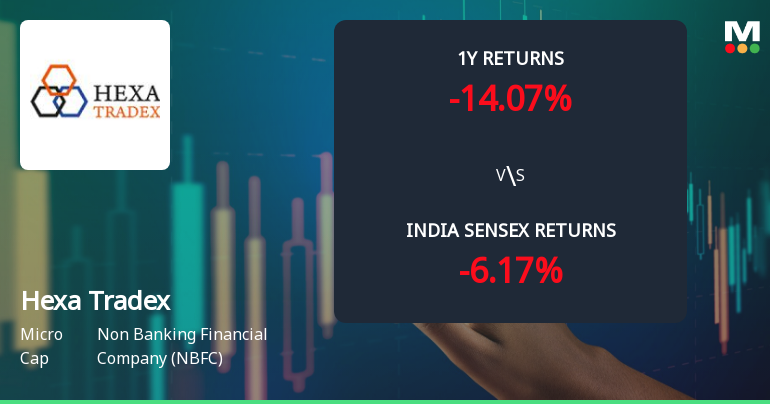
Below par performance in long term as well as near term
Stock DNA
Non Banking Financial Company (NBFC)
INR 895 Cr (Micro Cap)
NA (Loss Making)
23
0.00%
0.00
-0.27%
0.20
Total Returns (Price + Dividend) 
Hexa Tradex for the last several years.
Risk Adjusted Returns v/s
Returns Beta

News
Hexa Tradex Ltd Technical Momentum Shifts Amid Mixed Market Signals
Hexa Tradex Ltd, a micro-cap player in the Non Banking Financial Company (NBFC) sector, has experienced a notable shift in its technical momentum, moving from a mildly bullish to a mildly bearish stance. This transition is underscored by a complex interplay of technical indicators including MACD, RSI, moving averages, and other momentum oscillators, reflecting a nuanced market sentiment as the stock navigates volatile conditions.
Read full news article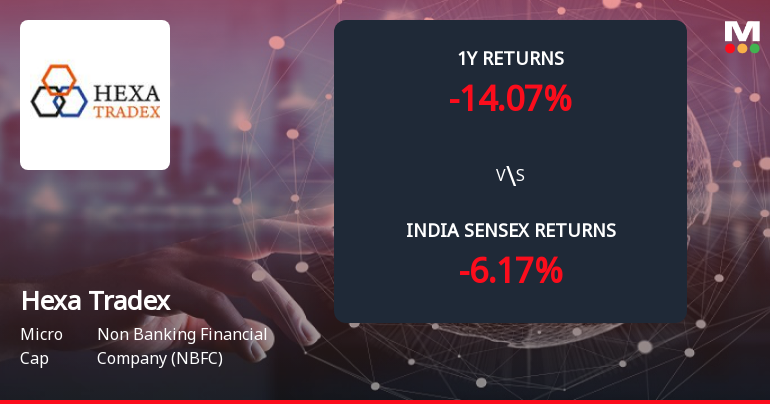
Hexa Tradex Ltd Forms Death Cross, Signalling Potential Bearish Trend
Hexa Tradex Ltd, a micro-cap player in the Non Banking Financial Company (NBFC) sector, has recently formed a Death Cross—a technical pattern where the 50-day moving average crosses below the 200-day moving average—indicating a potential shift towards a bearish trend and signalling long-term weakness in the stock’s price momentum.
Read full news article
Hexa Tradex Ltd Shows Signs of Technical Momentum Shift Amid Mixed Market Signals
Hexa Tradex Ltd, a micro-cap player in the Non Banking Financial Company (NBFC) sector, has exhibited a notable shift in its technical momentum, moving from a mildly bearish stance to a mildly bullish one. Despite a recent upgrade in its technical trend, the company’s overall MarketsMOJO grade remains at Sell, reflecting ongoing caution amid mixed indicator signals and a challenging market backdrop.
Read full news article Announcements
Closure of Trading Window
25-Jun-2026 | Source : BSEas attached
Shareholder Meeting / Postal Ballot-Outcome of AGM
24-Jun-2026 | Source : BSEAS ATTACHED
Reg. 34 (1) Annual Report.
29-May-2026 | Source : BSEAnnual Report for FY 2025-26
Corporate Actions

No Upcoming Board Meetings

No Dividend history available

No Splits history available

No Bonus history available

No Rights history available
Quality key factors
Valuation key factors
Technicals key factors
 Technical Indicator Scale: Bearish, Mildly Bearish, Sideways, Mildly Bullish, Bullish Turned
 Shareholding Snapshot : Mar 2026
Shareholding Compare (%holding)
Promoters
None
Held by 5 Schemes (0.01%)
Held by 9 FIIs (0.04%)
Nalwa Sons Investments Limited (19.39%)
Anil Kantiprasad Poddar (2.26%)
6.49%
Quarterly Results Snapshot (Consolidated) - Mar'26 - QoQ

QoQ Growth in quarter ended Mar 2026 is 7,150.00% vs -99.36% in Dec 2025
QoQ Growth in quarter ended Mar 2026 is 23.68% vs -388.76% in Dec 2025
Half Yearly Results Snapshot (Consolidated) - Sep'25
Growth in half year ended Sep 2025 is 1.63% vs -96.83% in Sep 2024
Growth in half year ended Sep 2025 is 97.79% vs -173.70% in Sep 2024
Nine Monthly Results Snapshot (Consolidated) - Dec'25
YoY Growth in nine months ended Dec 2025 is 2.29% vs -97.76% in Dec 2024
YoY Growth in nine months ended Dec 2025 is 74.59% vs -122.66% in Dec 2024
Annual Results Snapshot (Consolidated) - Mar'26
YoY Growth in year ended Mar 2026 is 0.44% vs -96.58% in Mar 2025
YoY Growth in year ended Mar 2026 is 65.05% vs -127.03% in Mar 2025
About Hexa Tradex Ltd

Company Coordinates


