
Compare Bhansali Engg. with Similar Stocks
Dashboard
The company is Net-Debt Free
Poor long term growth as Net Sales has grown by an annual rate of -0.25% and Operating profit at -13.79% over the last 5 years
The company has declared positive results in Mar'2026 after 2 consecutive negative quarters
With ROE of 16.6, it has a Very Attractive valuation with a 2.3 Price to Book Value
Despite the size of the company, domestic mutual funds hold only 0.01% of the company
Stock DNA
Specialty Chemicals
INR 2,657 Cr (Small Cap)
14.00
42
3.94%
-0.41
16.63%
2.33
Total Returns (Price + Dividend) 
Latest dividend: 0.9983719037097337 per share ex-dividend date: Feb-18-2026
Risk Adjusted Returns v/s
Returns Beta

News
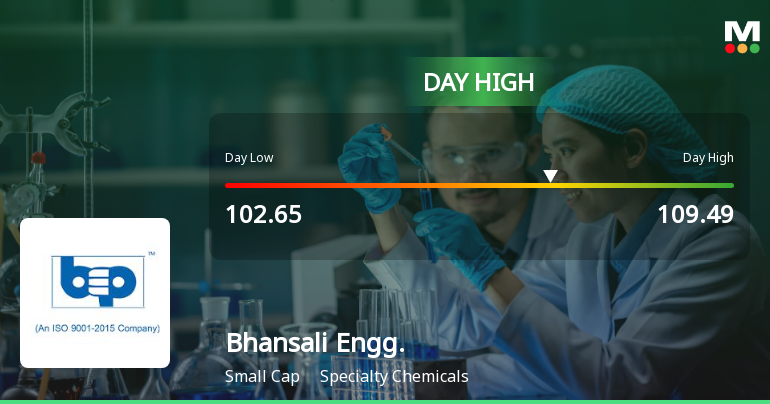
Bhansali Engineering Polymers Ltd Surges 7.11% to Day's High of Rs 109.49 — Outperforms Sector by 6.27 Percentage Points
The Sensex edged up 0.14% on 18 Jun 2026, but Bhansali Engineering Polymers Ltd outpaced the broader market with a 7.11% gain, reaching an intraday high of Rs 109.49. This 6.27 percentage-point outperformance over the Specialty Chemicals sector signals a distinctly stock-specific rally rather than a market-wide lift.
Read full news article
Bhansali Engineering Polymers Ltd is Rated Hold
Bhansali Engineering Polymers Ltd is rated 'Hold' by MarketsMOJO, with this rating last updated on 24 April 2026. While the rating was revised on that date, the analysis and financial metrics discussed here reflect the company’s current position as of 14 June 2026, providing investors with an up-to-date view of the stock’s fundamentals, valuation, financial trends, and technical outlook.
Read full news article
Bhansali Engineering Polymers Ltd is Rated Hold by MarketsMOJO
Bhansali Engineering Polymers Ltd is rated 'Hold' by MarketsMOJO, with this rating last updated on 24 April 2026. However, the analysis and financial metrics discussed here reflect the stock's current position as of 03 June 2026, providing investors with the latest insights into the company’s performance and outlook.
Read full news article Announcements
Announcement under Regulation 30 (LODR)-Analyst / Investor Meet - Intimation
15-Jun-2026 | Source : BSEMeeting with Ambit Capital and KC Capital is scheduled to be held on 16th June 2026.
42Nd Annual General Meeting Scheduled To Be Held On Tuesday 21St July 2026 At 11:30 AM Will Now Be Held Through VC (Video Conferencing) / OAVM (Other Audio Visual Means).
05-Jun-2026 | Source : BSEConvening of 42nd Annual General Meeting.
Compliances-Reg.24(A)-Annual Secretarial Compliance
29-May-2026 | Source : BSEAnnual Secretarial Compliance Report for the Financial year ended 31st March 2026.
Corporate Actions

No Upcoming Board Meetings

Bhansali Engineering Polymers Ltd has declared 100% dividend, ex-date: 13 Jul 26

No Splits history available

Bhansali Engineering Polymers Ltd has announced 1:2 bonus issue, ex-date: 05 Jul 23

No Rights history available
Quality key factors
Valuation key factors
Technicals key factors
 Technical Indicator Scale: Bearish, Mildly Bearish, Sideways, Mildly Bullish, Bullish Turned
 Shareholding Snapshot : Mar 2026
Shareholding Compare (%holding)
Promoters
None
Held by 2 Schemes (0.0%)
Held by 50 FIIs (1.35%)
Babulal M Bhansali (9.88%)
Bhavna Sanjay Seth (1.31%)
29.32%
Quarterly Results Snapshot (Consolidated) - Mar'26 - YoY

YoY Growth in quarter ended Mar 2026 is -0.97% vs 7.40% in Mar 2025

YoY Growth in quarter ended Mar 2026 is 30.63% vs -2.28% in Mar 2025
Half Yearly Results Snapshot (Consolidated) - Sep'25
Growth in half year ended Sep 2025 is -10.46% vs 16.14% in Sep 2024
Growth in half year ended Sep 2025 is -13.38% vs 0.97% in Sep 2024
Nine Monthly Results Snapshot (Consolidated) - Dec'25
YoY Growth in nine months ended Dec 2025 is -11.25% vs 16.91% in Dec 2024
YoY Growth in nine months ended Dec 2025 is -8.51% vs 1.14% in Dec 2024
Annual Results Snapshot (Consolidated) - Mar'26
YoY Growth in year ended Mar 2026 is -8.71% vs 14.41% in Mar 2025
YoY Growth in year ended Mar 2026 is 0.08% vs 0.36% in Mar 2025
About Bhansali Engineering Polymers Ltd

Company Coordinates


