
Compare Comfort Fincap with Similar Stocks
Stock DNA
Non Banking Financial Company (NBFC)
INR 73 Cr (Micro Cap)
9.00
21
1.22%
0.04
7.49%
0.72
Total Returns (Price + Dividend) 
Latest dividend: 0.1 per share ex-dividend date: Sep-04-2025
Risk Adjusted Returns v/s
Returns Beta

News
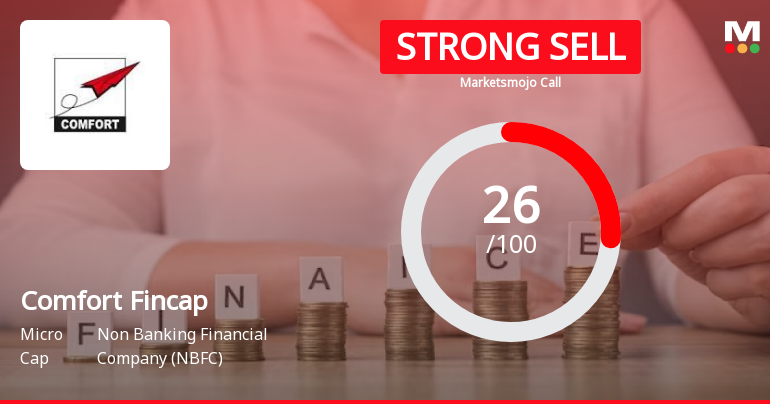
Comfort Fincap Ltd is Rated Strong Sell
Comfort Fincap Ltd is rated Strong Sell by MarketsMOJO. This rating was last updated on 14 May 2026, reflecting a shift from the previous 'Sell' grade. However, the analysis and financial metrics discussed here represent the stock's current position as of 10 July 2026, providing investors with an up-to-date view of the company’s fundamentals, valuation, financial trends, and technical outlook.
Read full news article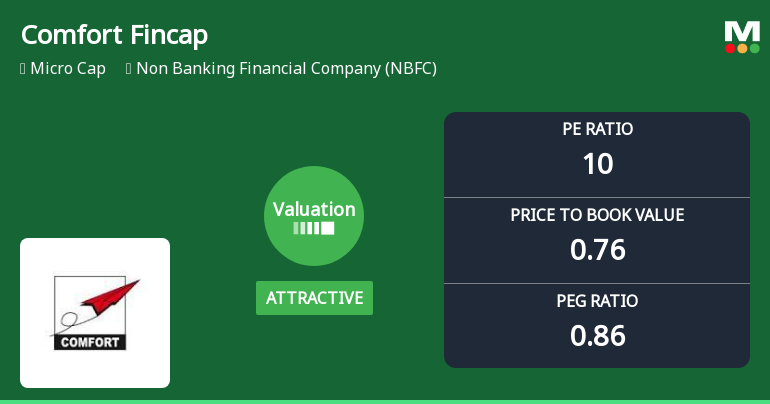
Comfort Fincap Ltd Valuation Shifts Signal Renewed Price Attractiveness
Comfort Fincap Ltd, a micro-cap player in the Non Banking Financial Company (NBFC) sector, has witnessed a notable shift in its valuation parameters, moving from a very attractive to an attractive rating. This change comes amid a strong day gain of 11.40% and a mixed performance relative to the Sensex over various time horizons. Despite a recent downgrade in its overall Mojo Grade to Strong Sell, the company’s improved price-to-earnings (P/E) and price-to-book value (P/BV) ratios suggest a more compelling valuation for investors willing to navigate the sector’s volatility.
Read full news article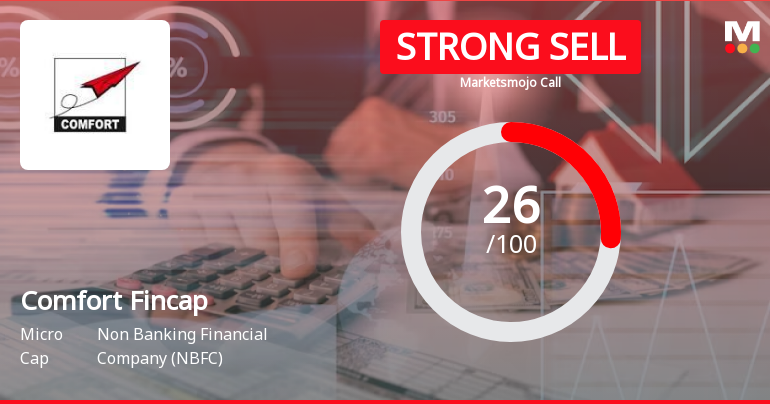
Comfort Fincap Ltd is Rated Strong Sell
Comfort Fincap Ltd is rated Strong Sell by MarketsMOJO, with this rating last updated on 14 May 2026. However, the analysis and financial metrics discussed here reflect the stock’s current position as of 29 June 2026, providing investors with an up-to-date view of the company’s fundamentals, valuation, financial trends, and technical outlook.
Read full news article Announcements
Compliances-Certificate under Reg. 74 (5) of SEBI (DP) Regulations 2018
10-Jul-2026 | Source : BSECertificate under Regulation 74(5) of SEBI (Depositories and Participants) Regulations 2018 for the quarter ended June 30 2026.
Intimation For Receipt Of Trading Approval For 8050000 Equity Shares Issued On Preferential Basis.
07-Jul-2026 | Source : BSEReceipt of Trading Approval for 8050000 equity shares issued on Preferential Basis.
Announcement under Regulation 30 (LODR)-Newspaper Publication
01-Jul-2026 | Source : BSEPursuant to Regulation 30 of SEBI Listing Regulation enclosed herewith Newspaper Advertisement in Form INC-26 regarding shifting of Registered office of the Company.
Corporate Actions

No Upcoming Board Meetings

Comfort Fincap Ltd has declared 5% dividend, ex-date: 04 Sep 25

Comfort Fincap Ltd has announced 2:10 stock split, ex-date: 04 May 23

No Bonus history available

No Rights history available
Quality key factors
Valuation key factors
Technicals key factors
 Technical Indicator Scale: Bearish, Mildly Bearish, Sideways, Mildly Bullish, Bullish Turned
 Shareholding Snapshot : Jun 2026
Shareholding Compare (%holding)
Promoters
None
Held by 0 Schemes
Held by 0 FIIs
Luharuka Investment & Consultants Pvt Ltd (24.37%)
Ashish Bansal (4.08%)
37.43%
Quarterly Results Snapshot (Consolidated) - Mar'26 - YoY

YoY Growth in quarter ended Mar 2026 is 3.36% vs 9.32% in Mar 2025

YoY Growth in quarter ended Mar 2026 is 38.96% vs 4.05% in Mar 2025
Half Yearly Results Snapshot (Consolidated) - Sep'25
Growth in half year ended Sep 2025 is 25.70% vs -16.13% in Sep 2024
Growth in half year ended Sep 2025 is 39.06% vs -5.71% in Sep 2024
Nine Monthly Results Snapshot (Consolidated) - Dec'25
YoY Growth in nine months ended Dec 2025 is 28.04% vs -8.78% in Dec 2024
YoY Growth in nine months ended Dec 2025 is 48.27% vs -2.48% in Dec 2024
Annual Results Snapshot (Consolidated) - Mar'26
YoY Growth in year ended Mar 2026 is 21.04% vs 13.47% in Mar 2025
YoY Growth in year ended Mar 2026 is 46.86% vs -0.97% in Mar 2025
About Comfort Fincap Ltd

Company Coordinates


