
Compare Ind-Agiv Commer. with Similar Stocks
Dashboard
With a Negative Book Value, the company has a Weak Long Term Fundamental Strength
- Poor long term growth as Net Sales has grown by an annual rate of -24.38% and Operating profit at 0% over the last 5 years
- The company has a negative book value of Rs 7.12 crore
Flat results in Dec 25
Risky - Negative EBITDA
Underperformed the market in the last 1 year
Stock DNA
Trading & Distributors
INR 15 Cr (Micro Cap)
NA (Loss Making)
21
0.00%
0.04
20.37%
-2.13
Total Returns (Price + Dividend) 
Latest dividend: 0.5 per share ex-dividend date: Aug-20-2019
Risk Adjusted Returns v/s
Returns Beta

News
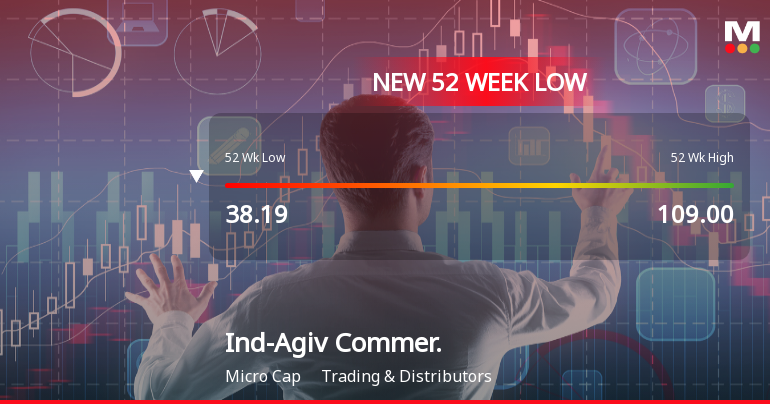
Ind-Agiv Commerce Ltd Falls to 52-Week Low of Rs 34.12 as Sell-Off Deepens
A sharp decline has pushed Ind-Agiv Commerce Ltd to a fresh 52-week low of Rs 34.12 on 27 Mar 2026, marking a significant 66.22% drop over the past year amid persistent selling pressure and deteriorating technical signals.
Read full news article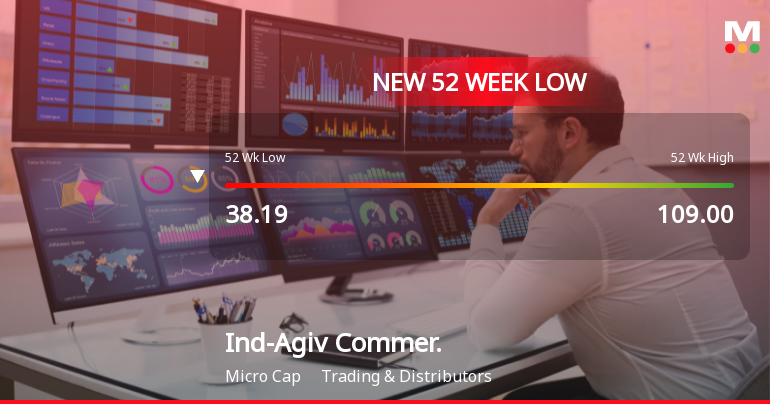
Markets Rally, But Ind-Agiv Commerce Ltd Sinks to 52-Week Low in Stock-Specific Sell-Off
While broader indices have shown signs of recovery, Ind-Agiv Commerce Ltd has continued its downward trajectory, hitting a fresh 52-week low of Rs 34.2 on 23 Mar 2026. The stock has declined over 10% in the past three sessions, underperforming both its sector and the wider market.
Read full news article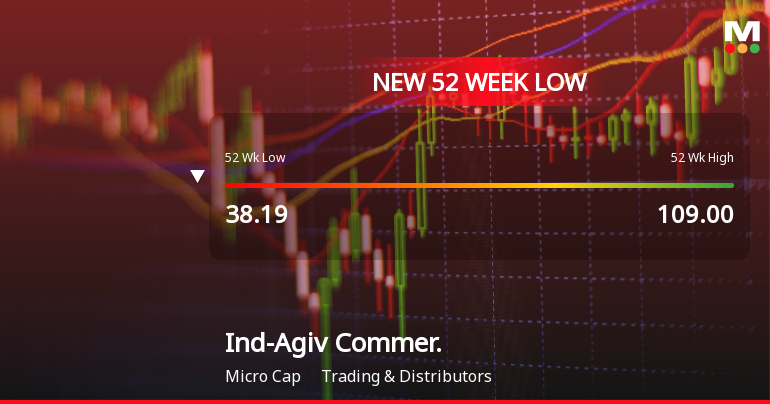
Markets Rally, But Ind-Agiv Commerce Ltd Sinks to 52-Week Low in Stock-Specific Sell-Off
Despite a broadly positive market environment, Ind-Agiv Commerce Ltd has plunged to a fresh 52-week low of Rs 36 on 20 Mar 2026, marking a steep decline of over 64% from its peak of Rs 109 in the past year. This stark underperformance contrasts sharply with the Sensex, which is trading near its own 52-week highs, underscoring the stock-specific pressures weighing on the company.
Read full news article Announcements
Compliances-Certificate under Reg. 74 (5) of SEBI (DP) Regulations 2018
24-Apr-2026 | Source : BSEWe submit herewith confirmation certificate under Regulation 74(5) of SEBI (Depositories and Participants) Regulations 2018 for the quarted ended on March 31 2026.
Announcement under Regulation 30 (LODR)-Resignation of Company Secretary / Compliance Officer
20-Apr-2026 | Source : BSEResignation of Mr. Omprakash Keshavdev Harshwal from the office of Company Secretary and Compliance Officer of the Company.
Resignation Of The Directors
12-Mar-2026 | Source : BSEResignations of the Directors
Corporate Actions

No Upcoming Board Meetings

Ind-Agiv Commerce Ltd has declared 5% dividend, ex-date: 20 Aug 19

No Splits history available

No Bonus history available

No Rights history available
Quality key factors
Valuation key factors
Technicals key factors
 Technical Indicator Scale: Bearish, Mildly Bearish, Sideways, Mildly Bullish, Bullish Turned
 Shareholding Snapshot : Mar 2026
Shareholding Compare (%holding)
Non Institution
None
Held by 0 Schemes
Held by 0 FIIs
Sushila . Rupani (18.06%)
Adtechno Inc (24.86%)
14.2%
Quarterly Results Snapshot (Consolidated) - Dec'25 - QoQ

QoQ Growth in quarter ended Dec 2025 is -83.33% vs -78.05% in Sep 2025

QoQ Growth in quarter ended Dec 2025 is 93.33% vs -200.00% in Sep 2025
Half Yearly Results Snapshot (Consolidated) - Sep'25
Not Applicable: The company has declared_date for only one period
Not Applicable: The company has declared_date for only one period
Nine Monthly Results Snapshot (Consolidated) - Dec'25
Not Applicable: The company has declared_date for only one period
Not Applicable: The company has declared_date for only one period
Annual Results Snapshot (Consolidated) - Mar'25
YoY Growth in year ended Mar 2025 is -56.42% vs -31.63% in Mar 2024
YoY Growth in year ended Mar 2025 is 39.87% vs -9.34% in Mar 2024
About Ind-Agiv Commerce Ltd

Company Coordinates


