
Compare Ashish Polyplast with Similar Stocks
Dashboard
Weak Long Term Fundamental Strength with an average Return on Capital Employed (ROCE) of 4.18%
- Poor long term growth as Net Sales has grown by an annual rate of 3.38% and Operating profit at 0.79% over the last 5 years
- Company's ability to service its debt is weak with a poor EBIT to Interest (avg) ratio of 0.28
Flat results in Mar 26
With ROCE of 3.4, it has a Expensive valuation with a 1.4 Enterprise value to Capital Employed
Below par performance in long term as well as near term
Stock DNA
Plastic Products - Industrial
INR 10 Cr (Micro Cap)
74.00
36
0.00%
0.15
1.90%
1.42
Total Returns (Price + Dividend) 
Latest dividend: 0.2000 per share ex-dividend date: Aug-29-2013
Risk Adjusted Returns v/s
Returns Beta

News

Ashish Polyplast Ltd Valuation Shifts Amid Market Pressure
Ashish Polyplast Ltd, a micro-cap player in the Plastic Products - Industrial sector, has witnessed a notable shift in its valuation parameters, reflecting changing market perceptions and operational challenges. Despite a strong historical return profile, recent valuation metrics and market performance suggest a cautious outlook for investors.
Read full news article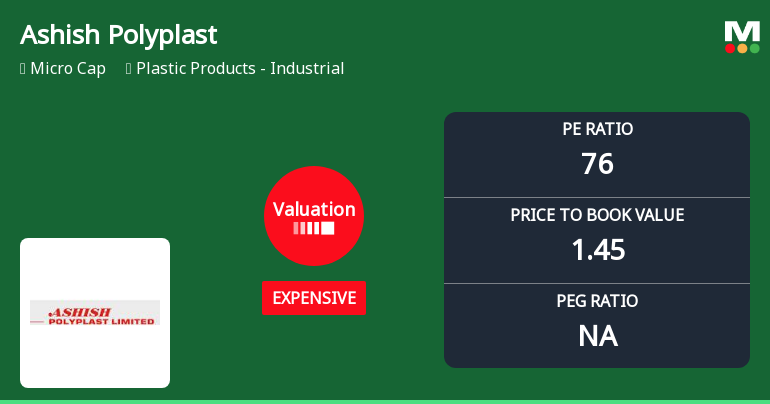
Ashish Polyplast Ltd Valuation Shifts Signal Price Attractiveness Challenges
Ashish Polyplast Ltd, a micro-cap player in the Plastic Products - Industrial sector, has seen its valuation parameters shift notably, with its price-to-earnings (P/E) ratio moving from very expensive to expensive territory. Despite a strong long-term return profile, recent market performance and fundamental metrics suggest caution for investors as the company grapples with stretched valuations and subdued profitability.
Read full news articleAre Ashish Polyplast Ltd latest results good or bad?
Ashish Polyplast Ltd's latest financial results for Q4 FY26 reveal a complex operational landscape characterized by significant challenges in profitability despite some revenue growth. The company reported net sales of ₹4.05 crores, reflecting a sequential growth of 14.41% from ₹3.54 crores in Q3 FY26 and a year-on-year increase of 10.66% from ₹3.66 crores in Q4 FY25. However, this revenue growth did not translate into profitability, as the company recorded a net loss of ₹0.34 crores, a notable shift from a profit of ₹0.15 crores in the previous quarter. The operating profit margin, excluding other income, was reported at 2.72%, down from 5.37% in Q3 FY26, indicating a decline in operational efficiency. This decrease in margins suggests that the company is facing increasing cost pressures or challenges in maintaining pricing power within its core PVC hose manufacturing business. Additionally, the company's...
Read full news article Announcements
Submission Of Financial Results For 31St March 2026
14-May-2026 | Source : BSESubmission of audited financial results for the 04th quarter and year ended on 31st March 2026 along with report of auditor and declaration for unmodified opinion.
Board Meeting Outcome for Outcome Of Board Meeting Held On May 14 2026
14-May-2026 | Source : BSEAn intimation of outcome of board meeting held on 14th May 2026 to consider Audited Financial results for 4th Quarter and year ended 31st March 2026.
Submission Of Financial Results For 31St March 2026
14-May-2026 | Source : BSESubmission of audited financial results for the 04th quarter and year ended on 31st March 2026 along with report of auditor and declaration for unmodified opinion.
Corporate Actions

No Upcoming Board Meetings

Ashish Polyplast Ltd has declared 1% dividend, ex-date: 29 Aug 13

No Splits history available

No Bonus history available

No Rights history available
Quality key factors
Valuation key factors
Technicals key factors
 Technical Indicator Scale: Bearish, Mildly Bearish, Sideways, Mildly Bullish, Bullish Turned
 Shareholding Snapshot : Mar 2026
Shareholding Compare (%holding)
Promoters
None
Held by 0 Schemes
Held by 0 FIIs
Ashish Dahyabhai Panchal (54.74%)
Sangeetha S (3.29%)
32.44%
Quarterly Results Snapshot (Standalone) - Mar'26 - QoQ

QoQ Growth in quarter ended Mar 2026 is 14.41% vs -4.07% in Dec 2025

QoQ Growth in quarter ended Mar 2026 is -326.67% vs 314.29% in Dec 2025
Half Yearly Results Snapshot (Standalone) - Sep'25
Growth in half year ended Sep 2025 is -5.83% vs -1.87% in Sep 2024
Growth in half year ended Sep 2025 is -49.21% vs 70.27% in Sep 2024
Nine Monthly Results Snapshot (Standalone) - Dec'25
YoY Growth in nine months ended Dec 2025 is -11.25% vs 3.34% in Dec 2024
YoY Growth in nine months ended Dec 2025 is -27.69% vs -15.58% in Dec 2024
Annual Results Snapshot (Standalone) - Mar'26
YoY Growth in year ended Mar 2026 is -6.18% vs 0.44% in Mar 2025
YoY Growth in year ended Mar 2026 is -48.00% vs -70.24% in Mar 2025
About Ashish Polyplast Ltd

Company Coordinates


