
Compare Coastal Roadways with Similar Stocks
Dashboard
Weak Long Term Fundamental Strength with an average Return on Equity (ROE) of 5.20%
- Poor long term growth as Net Sales has grown by an annual rate of 4.95% over the last 5 years
- Company's ability to service its debt is weak with a poor EBIT to Interest (avg) ratio of 1.15
Flat results in Mar 26
Below par performance in long term as well as near term
Stock DNA
Transport Services
INR 10 Cr (Micro Cap)
7.00
34
0.00%
-0.18
6.25%
0.43
Total Returns (Price + Dividend) 
Latest dividend: 0.9000 per share ex-dividend date: Jul-19-2012
Risk Adjusted Returns v/s
Returns Beta

News
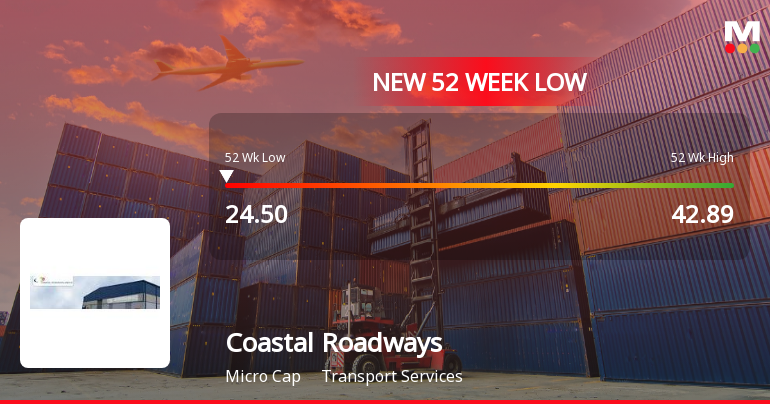

Coastal Roadways Ltd Valuation Shifts Signal Renewed Price Attractiveness
Coastal Roadways Ltd has seen a notable shift in its valuation parameters, moving from an attractive to a very attractive rating despite ongoing market headwinds and a recent downgrade in its overall mojo grade. The micro-cap transport services company’s price-to-earnings (P/E) and price-to-book value (P/BV) ratios have compressed significantly, presenting a compelling valuation case relative to its historical averages and peer group, even as its share price continues to face pressure.
Read full news articleAre Coastal Roadways Ltd latest results good or bad?
Coastal Roadways Ltd's latest financial results for the quarter ended March 2026 present a mixed picture, highlighting both operational achievements and significant challenges. The company reported a net sales figure of ₹10.50 crores, reflecting a modest quarter-on-quarter growth of 2.24%. However, this performance is accompanied by a year-on-year decline of 1.78%, indicating ongoing revenue stagnation. Operationally, Coastal Roadways achieved its highest operating margin in recent quarters at 9.90%, an improvement from 8.28% in the previous quarter. This suggests enhanced operational efficiency, as the operating profit before depreciation, interest, tax, and other income (PBDIT excluding OI) reached ₹1.04 crores, marking a notable increase. Despite these operational gains, the company faced a substantial challenge with negative other income of ₹0.72 crores, which severely impacted its bottom-line profitab...
Read full news article Announcements
Announcement under Regulation 30 (LODR)-Newspaper Publication
27-May-2026 | Source : BSESubmission of Newspaper Advertisement of Audited Financial Results of the Company for the Quarter and Year ended 31st March 2026.
Board Meeting Outcome for Outcome Of Board Meeting Dated 26Th May 2026
26-May-2026 | Source : BSEOutcome of Board Meeting dated 26th May 2026
Results-Audited Financial Results For The Quarter And Year Ended 31St March 2026
26-May-2026 | Source : BSEAudited Financial Results for the Quarter and Year ended 31st March 2026
Corporate Actions

No Upcoming Board Meetings

Coastal Roadways Ltd has declared 9% dividend, ex-date: 19 Jul 12

No Splits history available

No Bonus history available

No Rights history available
Quality key factors
Valuation key factors
Technicals key factors
 Technical Indicator Scale: Bearish, Mildly Bearish, Sideways, Mildly Bullish, Bullish Turned
 Shareholding Snapshot : Mar 2026
Shareholding Compare (%holding)
Promoters
None
Held by 1 Schemes (0.01%)
Held by 0 FIIs
Coastal Agro Tech (india) Pvt. Ltd. (14.75%)
Jugal Kishore Agarwal (1.21%)
18.44%
Quarterly Results Snapshot (Standalone) - Mar'26 - QoQ

QoQ Growth in quarter ended Mar 2026 is 2.24% vs 0.20% in Dec 2025

QoQ Growth in quarter ended Mar 2026 is -93.75% vs 3,100.00% in Dec 2025
Half Yearly Results Snapshot (Standalone) - Sep'25
Growth in half year ended Sep 2025 is 3.88% vs 5.99% in Sep 2024
Growth in half year ended Sep 2025 is -33.83% vs -12.50% in Sep 2024
Nine Monthly Results Snapshot (Standalone) - Dec'25
YoY Growth in nine months ended Dec 2025 is 1.85% vs 10.06% in Dec 2024
YoY Growth in nine months ended Dec 2025 is -14.12% vs 9.94% in Dec 2024
Annual Results Snapshot (Standalone) - Mar'26
YoY Growth in year ended Mar 2026 is 0.90% vs 7.22% in Mar 2025
YoY Growth in year ended Mar 2026 is 6.12% vs -34.96% in Mar 2025
About Coastal Roadways Ltd

Company Coordinates


