
Compare Century Plyboard with Similar Stocks
Dashboard
Strong ability to service debt as the company has a low Debt to EBITDA ratio of 2.71 times
Healthy long term growth as Net Sales has grown by an annual rate of 20.43%
Positive results in Mar 26
With ROCE of 10.9, it has a Fair valuation with a 4.3 Enterprise value to Capital Employed
Reducing Promoter Confidence
Stock DNA
Plywood Boards/ Laminates
INR 16,547 Cr (Small Cap)
63.00
53
0.13%
0.65
10.29%
6.33
Total Returns (Price + Dividend) 
Latest dividend: 1 per share ex-dividend date: Sep-11-2025
Risk Adjusted Returns v/s
Returns Beta

News
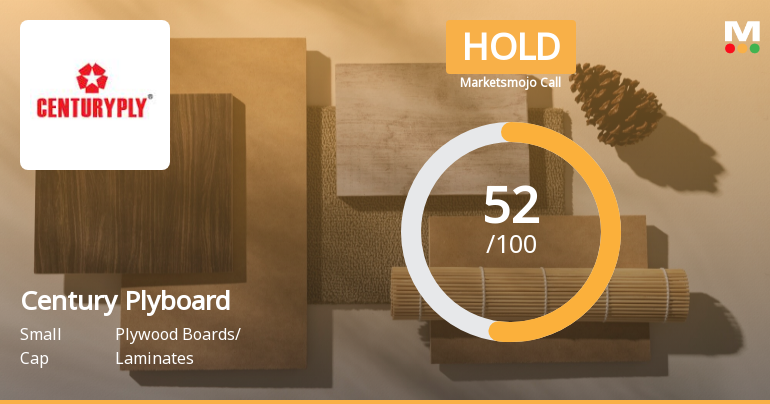
Century Plyboards (India) Ltd is Rated Hold
Century Plyboards (India) Ltd is rated 'Hold' by MarketsMOJO, with this rating last updated on 22 May 2026. While the rating change occurred on that date, the analysis and financial metrics presented here reflect the stock's current position as of 19 June 2026, providing investors with the most up-to-date view of the company’s fundamentals, returns, and market standing.
Read full news article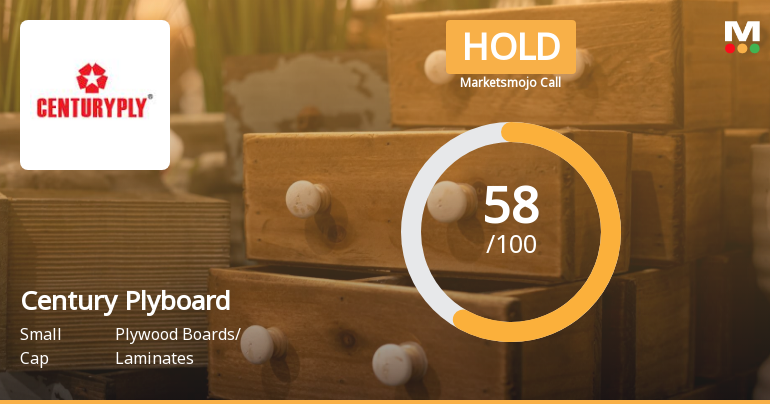
Century Plyboards (India) Ltd is Rated Hold
Century Plyboards (India) Ltd is rated 'Hold' by MarketsMOJO, with this rating last updated on 22 May 2026. However, the analysis and financial metrics discussed here reflect the stock's current position as of 08 June 2026, providing investors with an up-to-date view of the company’s fundamentals, returns, and market standing.
Read full news article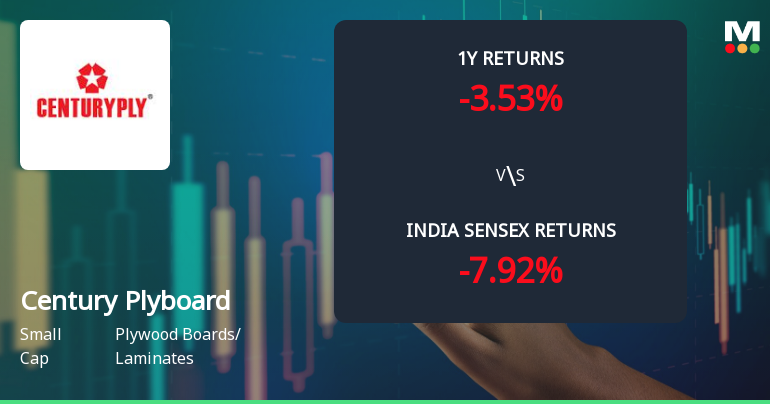
Century Plyboards (India) Ltd Technical Momentum Shifts Amid Mixed Signals
Century Plyboards (India) Ltd has experienced a notable shift in its technical momentum, transitioning from a mildly bearish stance to a more sideways trend. This change is underscored by a complex interplay of technical indicators, including MACD, RSI, and moving averages, which collectively suggest a cautious but watchful market sentiment towards the plywood boards and laminates sector.
Read full news article Announcements
Closure of Trading Window
20-Jun-2026 | Source : BSEThe Trading window for dealing in securities of the Company is being closed for all the Directors Designated Persons of the Company and their immediate relatives on and from 1st July 2026 and would reopen after expiry of 48 hours from the announcement of Unaudited financial results for the quarter ended 30th June 2026.
Announcement under Regulation 30 (LODR)-Newspaper Publication
12-Jun-2026 | Source : BSEAdvertisement published in newspaper regarding transfer of Equity Shares to IEPF Account
Announcement under Regulation 30 (LODR)-Newspaper Publication
06-Jun-2026 | Source : BSECopy of newspaper publication for second 100 days campaign- Saksham Niveshak
Corporate Actions

No Upcoming Board Meetings

Century Plyboards (India) Ltd has declared 100% dividend, ex-date: 11 Sep 25

Century Plyboards (India) Ltd has announced 1:10 stock split, ex-date: 24 Apr 08

No Bonus history available

No Rights history available
Quality key factors
Valuation key factors
Technicals key factors
 Technical Indicator Scale: Bearish, Mildly Bearish, Sideways, Mildly Bullish, Bullish Turned
 Shareholding Snapshot : Mar 2026
Shareholding Compare (%holding)
Promoters
None
Held by 15 Schemes (16.46%)
Held by 101 FIIs (4.1%)
Sanjay Agarwal (11.22%)
Kotak Aggressive Hybrid Fund (4.46%)
2.52%
Quarterly Results Snapshot (Consolidated) - Mar'26 - YoY

YoY Growth in quarter ended Mar 2026 is 24.52% vs 12.97% in Mar 2025
YoY Growth in quarter ended Mar 2026 is 48.81% vs -34.03% in Mar 2025
Half Yearly Results Snapshot (Consolidated) - Sep'25
Growth in half year ended Sep 2025 is 16.71% vs 15.95% in Sep 2024
Growth in half year ended Sep 2025 is 62.32% vs -59.52% in Sep 2024
Nine Monthly Results Snapshot (Consolidated) - Dec'25

YoY Growth in nine months ended Dec 2025 is 17.29% vs 17.85% in Dec 2024
YoY Growth in nine months ended Dec 2025 is 38.98% vs -46.19% in Dec 2024
Annual Results Snapshot (Consolidated) - Mar'26
YoY Growth in year ended Mar 2026 is 19.20% vs 16.52% in Mar 2025
YoY Growth in year ended Mar 2026 is 41.75% vs -43.22% in Mar 2025
About Century Plyboards (India) Ltd

Company Coordinates


