
Compare Sri Nacha. Cott. with Similar Stocks
Dashboard
High Debt company with Weak Long Term Fundamental Strength
- Poor long term growth as Net Sales has grown by an annual rate of -16.35% and Operating profit at -197.98% over the last 5 years
- High Debt Company with a Debt to Equity ratio (avg) of 2.64 times
- The company has been able to generate a Return on Equity (avg) of 4.30% signifying low profitability per unit of shareholders funds
Flat results in Mar 26
Risky - Negative EBITDA
Consistent Underperformance against the benchmark over the last 3 years
Stock DNA
Garments & Apparels
INR 13 Cr (Micro Cap)
NA (Loss Making)
26
0.00%
3.94
-84.54%
1.02
Total Returns (Price + Dividend) 
Latest dividend: 1.3000 per share ex-dividend date: Nov-29-2006
Risk Adjusted Returns v/s
Returns Beta

News
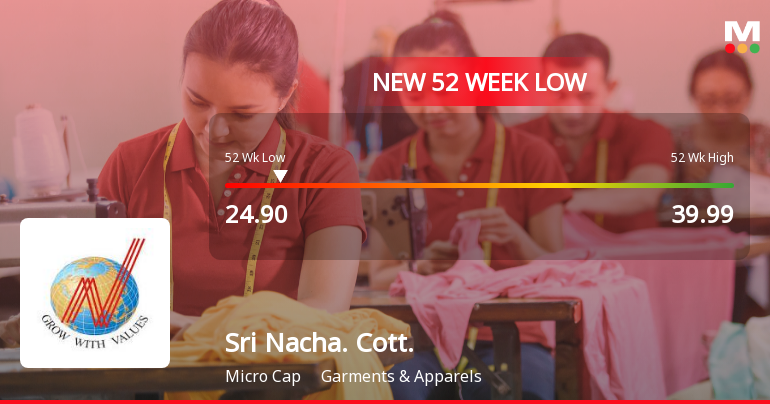
Sri Nachammai Cotton Mills Ltd Falls to 52-Week Low of Rs 24.9 as Sell-Off Deepens
For the second consecutive session, Sri Nachammai Cotton Mills Ltd has succumbed to selling pressure, hitting a fresh 52-week low of Rs 24.9 on 29 Jun 2026. This decline extends the stock’s underperformance trend amid a broader market that remains relatively stable.
Read full news article
Sri Nachammai Cotton Mills Ltd Downgraded to Strong Sell Amid Weak Fundamentals and Bearish Technicals
Sri Nachammai Cotton Mills Ltd, a micro-cap player in the Garments & Apparels sector, has seen its investment rating downgraded from Sell to Strong Sell as of 09 Jun 2026. This revision reflects deteriorating technical indicators, stagnant financial performance, weak valuation metrics, and a negative financial trend, signalling heightened risk for investors amid challenging market conditions.
Read full news article
Sri Nachammai Cotton Mills Ltd Downgraded to Strong Sell Amid Weak Fundamentals and Mixed Technicals
Sri Nachammai Cotton Mills Ltd, a micro-cap player in the Garments & Apparels sector, has seen its investment rating downgraded from Sell to Strong Sell as of 1 June 2026. This adjustment reflects deteriorating financial fundamentals, challenging valuation metrics, and a mixed technical outlook, signalling heightened risk for investors amid a volatile market environment.
Read full news article Announcements
Compliances-Certificate under Reg. 74 (5) of SEBI (DP) Regulations 2018
10-Jul-2026 | Source : BSEWe hereby submit the certificate dated 03/07/2026 received from cameo corporate service limited for the quarter ended 30/06/2026.
Closure of Trading Window
22-Jun-2026 | Source : BSEIt is hereby informed that the trading window for dealing in the companys equity share by the designated persons and their immediate relatives will be closed from 1st July 2026 till 48 hours after the declaration of unaudited financials for the quarter ended 30th June 2026.
Compliances-Reg.24(A)-Annual Secretarial Compliance
21-May-2026 | Source : BSEWe herewith submit the Annual Secretarial Compliance report.
Corporate Actions

No Upcoming Board Meetings

Sri Nachammai Cotton Mills Ltd has declared 13% dividend, ex-date: 29 Nov 06

No Splits history available

No Bonus history available

No Rights history available
Quality key factors
Valuation key factors
Technicals key factors
 Technical Indicator Scale: Bearish, Mildly Bearish, Sideways, Mildly Bullish, Bullish Turned
 Shareholding Snapshot : Jun 2026
Shareholding Compare (%holding)
Promoters
None
Held by 1 Schemes (0.01%)
Held by 0 FIIs
P Umayal (24.1%)
Raju Bhandari (9.88%)
41.77%
Quarterly Results Snapshot (Standalone) - Mar'26 - YoY

YoY Growth in quarter ended Mar 2026 is -18.73% vs -1.35% in Mar 2025
YoY Growth in quarter ended Mar 2026 is -731.15% vs -405.00% in Mar 2025
Half Yearly Results Snapshot (Standalone) - Sep'25

Growth in half year ended Sep 2025 is -2.14% vs -9.79% in Sep 2024
Growth in half year ended Sep 2025 is 394.56% vs 60.16% in Sep 2024
Nine Monthly Results Snapshot (Standalone) - Dec'25
YoY Growth in nine months ended Dec 2025 is -2.38% vs 6.38% in Dec 2024
YoY Growth in nine months ended Dec 2025 is 149.03% vs 47.99% in Dec 2024
Annual Results Snapshot (Standalone) - Mar'26
YoY Growth in year ended Mar 2026 is -6.71% vs 4.23% in Mar 2025
YoY Growth in year ended Mar 2026 is -18.38% vs 32.99% in Mar 2025
About Sri Nachammai Cotton Mills Ltd

Company Coordinates


