
Compare PDS with Similar Stocks
Stock DNA
Garments & Apparels
INR 5,248 Cr (Small Cap)
45.00
25
0.94%
0.13
6.33%
2.86
Total Returns (Price + Dividend) 
Latest dividend: 1.6300525677314999 per share ex-dividend date: Oct-31-2025
Risk Adjusted Returns v/s
Returns Beta

News

PDS Ltd Technical Momentum Shifts Amid Mixed Market Signals
PDS Ltd, a small-cap player in the Garments & Apparels sector, has exhibited a notable shift in its technical momentum, moving from a mildly bearish stance to a sideways trend. Despite a recent upgrade in daily price action, mixed signals from key technical indicators such as MACD, RSI, and moving averages suggest a cautious outlook for investors as the stock navigates volatile market conditions.
Read full news article
PDS Ltd Technical Momentum Shifts Amid Mixed Market Signals
PDS Ltd, a small-cap player in the Garments & Apparels sector, has experienced a notable shift in its technical momentum, moving from a sideways trend to a mildly bearish stance. Despite a recent day gain of 2.17%, the company’s technical indicators present a complex picture, with mixed signals from MACD, RSI, moving averages, and other momentum oscillators, prompting a downgrade in its Mojo Grade from Hold to Sell as of 28 July 2025.
Read full news article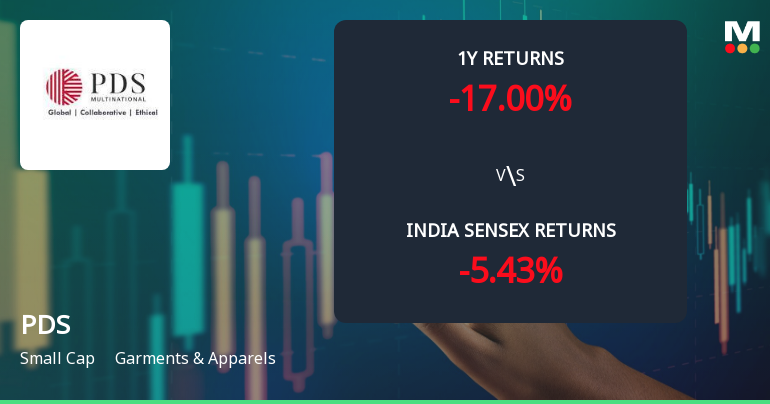
PDS Ltd Technical Momentum Shifts Amid Mixed Market Signals
PDS Ltd, a small-cap player in the Garments & Apparels sector, has experienced a notable shift in its technical momentum, moving from a mildly bearish stance to a sideways trend. Despite a modest day change of 0.42% to close at ₹337.00, the stock’s technical indicators present a complex picture, with weekly signals showing mild bullishness contrasting with monthly bearish tendencies. This article analyses the recent technical parameter changes, key momentum indicators, and what these mean for investors navigating the stock’s evolving landscape.
Read full news article Announcements
Announcement under Regulation 30 (LODR)-Investor Presentation
15-Jun-2026 | Source : BSEPDS Limited has informed the stock exchange regarding the Investor Presentation for PDS Investor Day.
Announcement under Regulation 30 (LODR)-Newspaper Publication
13-Jun-2026 | Source : BSEPDS Limited has informed the stock exchange regarding Newspaper Publication.
Announcement under Regulation 30 (LODR)-Analyst / Investor Meet - Intimation
10-Jun-2026 | Source : BSEPDS Limited has informed the stock exchange regarding the schedule of investor meet.
Corporate Actions

No Upcoming Board Meetings

PDS Ltd has declared 82% dividend, ex-date: 24 Jul 26

PDS Ltd has announced 2:10 stock split, ex-date: 26 Aug 22

No Bonus history available

No Rights history available
Quality key factors
Valuation key factors
Technicals key factors
 Technical Indicator Scale: Bearish, Mildly Bearish, Sideways, Mildly Bullish, Bullish Turned
 Shareholding Snapshot : Mar 2026
Shareholding Compare (%holding)
Promoters
None
Held by 3 Schemes (3.55%)
Held by 37 FIIs (3.32%)
Payel Seth (49.25%)
Sanjiv Dhireshbhai Shah (5.18%)
20.33%
Quarterly Results Snapshot (Consolidated) - Mar'26 - YoY

YoY Growth in quarter ended Mar 2026 is -0.19% vs 9.66% in Mar 2025

YoY Growth in quarter ended Mar 2026 is 21.71% vs -11.97% in Mar 2025
Half Yearly Results Snapshot (Consolidated) - Sep'25
Growth in half year ended Sep 2025 is 8.29% vs 29.48% in Sep 2024
Growth in half year ended Sep 2025 is -48.63% vs -0.17% in Sep 2024
Nine Monthly Results Snapshot (Consolidated) - Dec'25
YoY Growth in nine months ended Dec 2025 is 5.95% vs 26.47% in Dec 2024
YoY Growth in nine months ended Dec 2025 is -43.80% vs 13.19% in Dec 2024
Annual Results Snapshot (Consolidated) - Mar'26
YoY Growth in year ended Mar 2026 is 4.23% vs 21.26% in Mar 2025
YoY Growth in year ended Mar 2026 is -28.81% vs 8.78% in Mar 2025
About PDS Ltd

Company Coordinates


