
Compare Polyplex Corpn with Similar Stocks
Dashboard
Poor Management Efficiency with a low ROE of 6.97%
- The company has been able to generate a Return on Equity (avg) of 6.97% signifying low profitability per unit of shareholders funds
Poor long term growth as Operating profit has grown by an annual rate -160.98% of over the last 5 years
Flat results in Mar 26
Risky - Negative Operating Profits
99.81% of Promoter Shares are Pledged
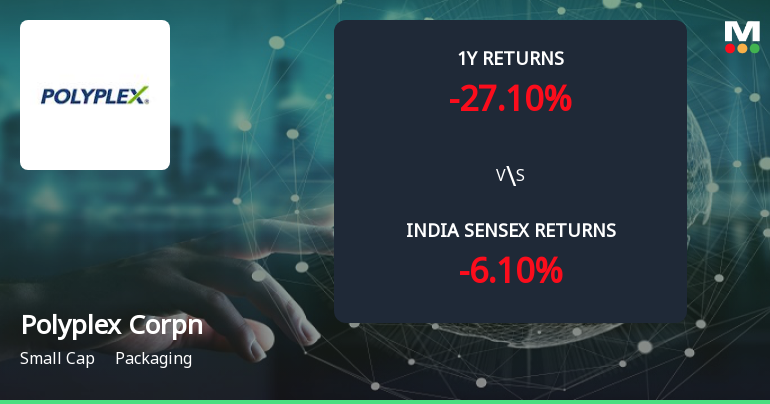
Underperformed the market in the last 1 year
Total Returns (Price + Dividend) 
Latest dividend: 2.0030010965545104 per share ex-dividend date: Nov-21-2025
Risk Adjusted Returns v/s
Returns Beta

News
Golden Cross Forms in Polyplex Corporation Ltd — Mixed Technical Signals Cloud the Outlook
The 50-day moving average has crossed above the 200-day moving average for Polyplex Corporation Ltd, signalling a golden cross on 16 Jun 2026. Yet, the stock’s technical indicators and fundamental backdrop present a nuanced picture that tempers the enthusiasm typically associated with this crossover.
Read full news article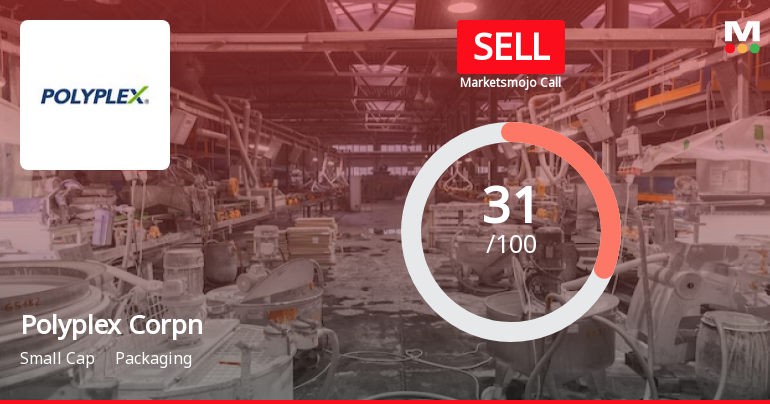
Polyplex Corporation Ltd is Rated Sell
Polyplex Corporation Ltd is rated 'Sell' by MarketsMOJO, with this rating last updated on 24 May 2026. However, the analysis and financial metrics discussed here reflect the stock’s current position as of 14 June 2026, providing investors with an up-to-date view of the company’s fundamentals, returns, and market standing.
Read full news article
Polyplex Corporation Ltd is Rated Sell
Polyplex Corporation Ltd is rated 'Sell' by MarketsMOJO, with this rating last updated on 24 May 2026. However, the analysis and financial metrics discussed here reflect the stock's current position as of 03 June 2026, providing investors with an up-to-date view of the company’s fundamentals, returns, and market performance.
Read full news article Announcements
Announcement under Regulation 30 (LODR)-Newspaper Publication
05-Jun-2026 | Source : BSENewspaper Advertisements for Notice of Postal Ballot by way of remote evoting
Shareholder Meeting / Postal Ballot-Notice of Postal Ballot
04-Jun-2026 | Source : BSENotice of Postal Ballot
Compliances-Reg.24(A)-Annual Secretarial Compliance
29-May-2026 | Source : BSEAnnual Secretarial Compliance Report for the financial year ended on March 31 2026
Corporate Actions

No Upcoming Board Meetings

Polyplex Corporation Ltd has declared 20% dividend, ex-date: 21 Nov 25

No Splits history available

Polyplex Corporation Ltd has announced 1:1 bonus issue, ex-date: 23 Dec 10

No Rights history available
Quality key factors
Valuation key factors
Technicals key factors
 Technical Indicator Scale: Bearish, Mildly Bearish, Sideways, Mildly Bullish, Bullish Turned
 Shareholding Snapshot : Mar 2026
Shareholding Compare (%holding)
Non Institution
99.8095
Held by 2 Schemes (2.09%)
Held by 68 FIIs (9.9%)
Secure Investments Limited (22.1%)
Agp Holdco Limited (24.28%)
28.4%
Quarterly Results Snapshot (Consolidated) - Mar'26 - QoQ

QoQ Growth in quarter ended Mar 2026 is 11.19% vs -6.22% in Dec 2025
QoQ Growth in quarter ended Mar 2026 is 68.02% vs -40.24% in Dec 2025
Half Yearly Results Snapshot (Consolidated) - Sep'25

Growth in half year ended Sep 2025 is 3.16% vs 9.32% in Sep 2024
Growth in half year ended Sep 2025 is -96.19% vs 469.65% in Sep 2024
Nine Monthly Results Snapshot (Consolidated) - Dec'25
YoY Growth in nine months ended Dec 2025 is 1.35% vs 11.18% in Dec 2024
YoY Growth in nine months ended Dec 2025 is -89.88% vs 576.98% in Dec 2024
Annual Results Snapshot (Consolidated) - Mar'26
YoY Growth in year ended Mar 2026 is 2.91% vs 9.17% in Mar 2025
YoY Growth in year ended Mar 2026 is -78.51% vs 453.03% in Mar 2025
About Polyplex Corporation Ltd

Company Coordinates


